Completion
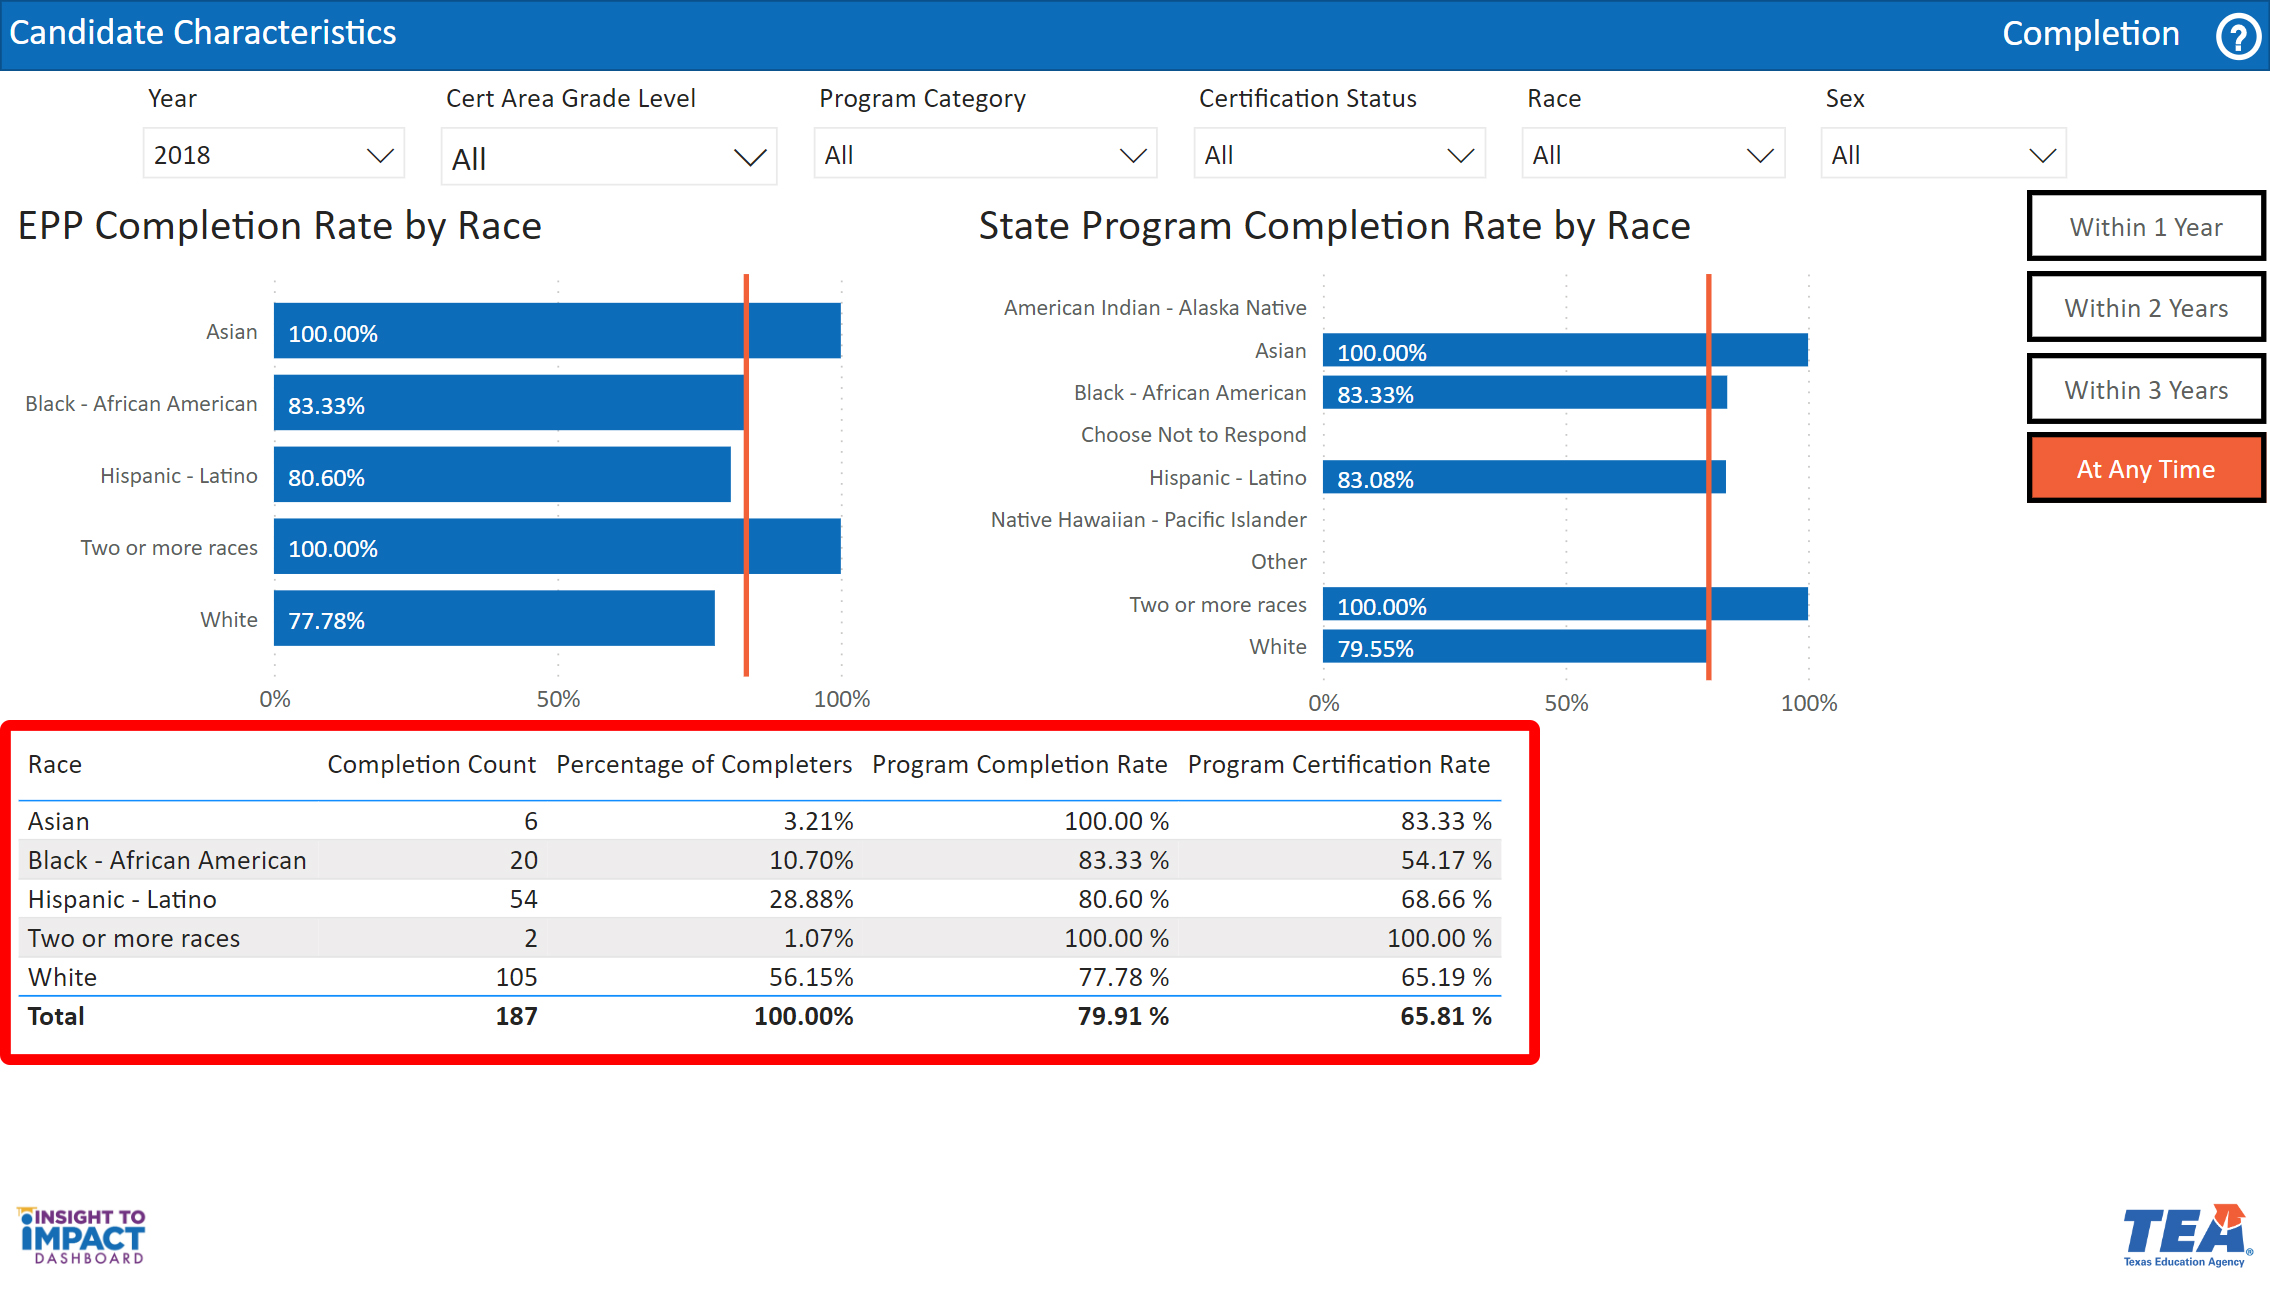
Details candidate completion rates by race/ethnicity for your EPP at different time points: Within 1 year, Within 2 years, Within 3 years, or At Any Time. A side-by-side visualization reflects state level completion rates for comparison.
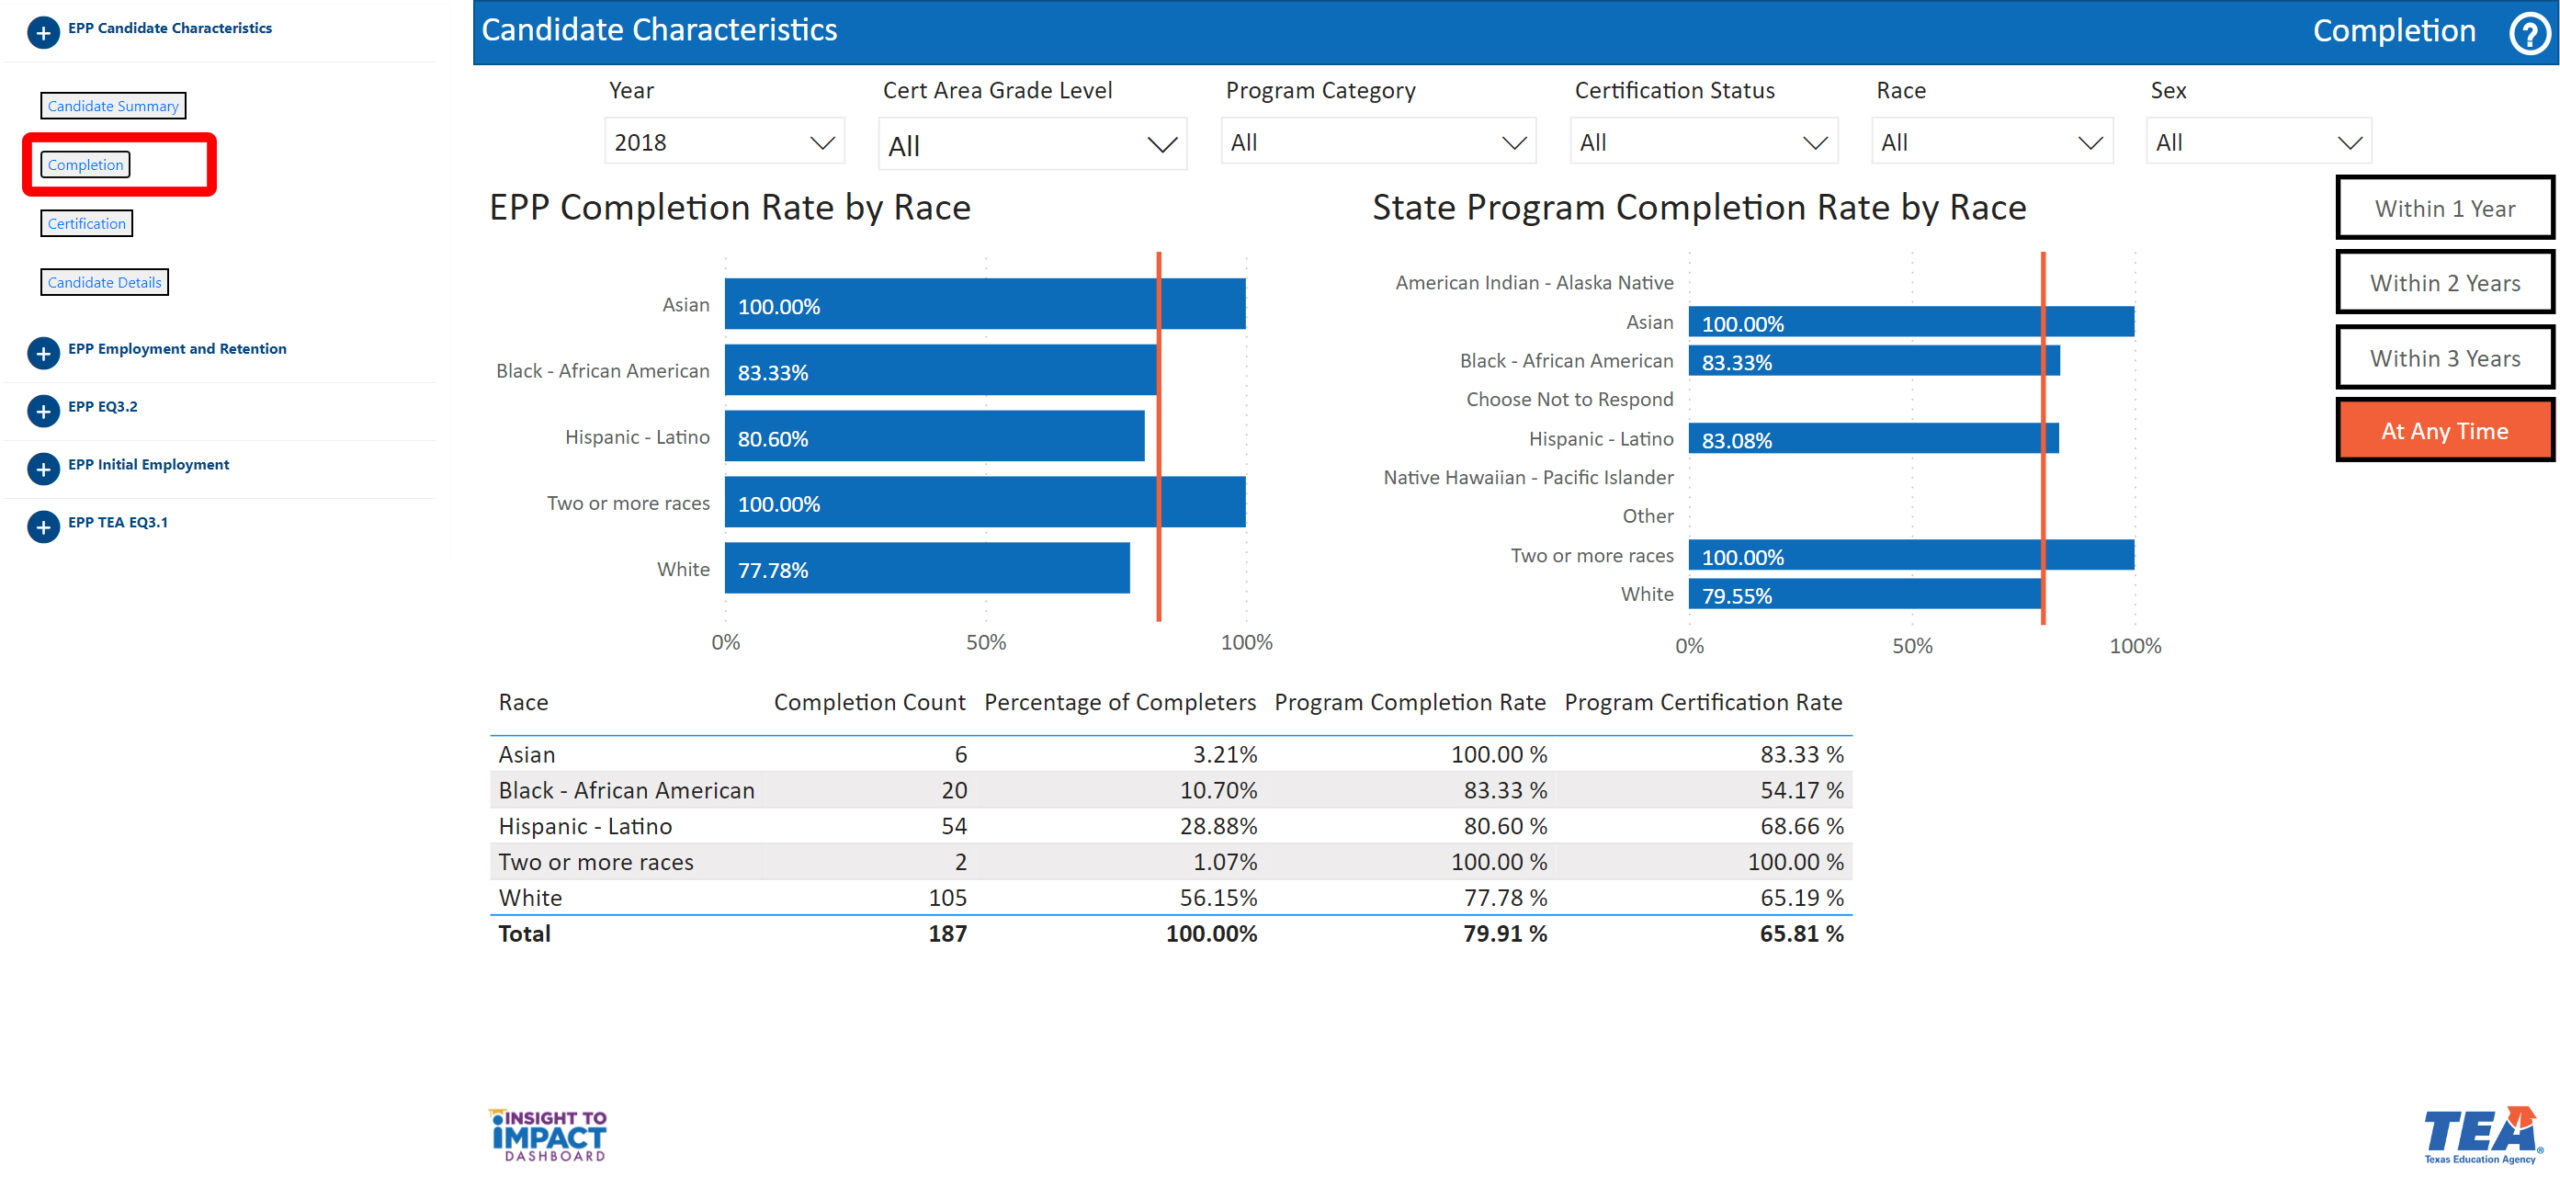
Navigate to the Completion Page
Select the “Completion” page from the Menu. On this page, you will be able to filter information by Year, Certification Area Grade Level, Program Category, Certification Status, Race, and Gender.
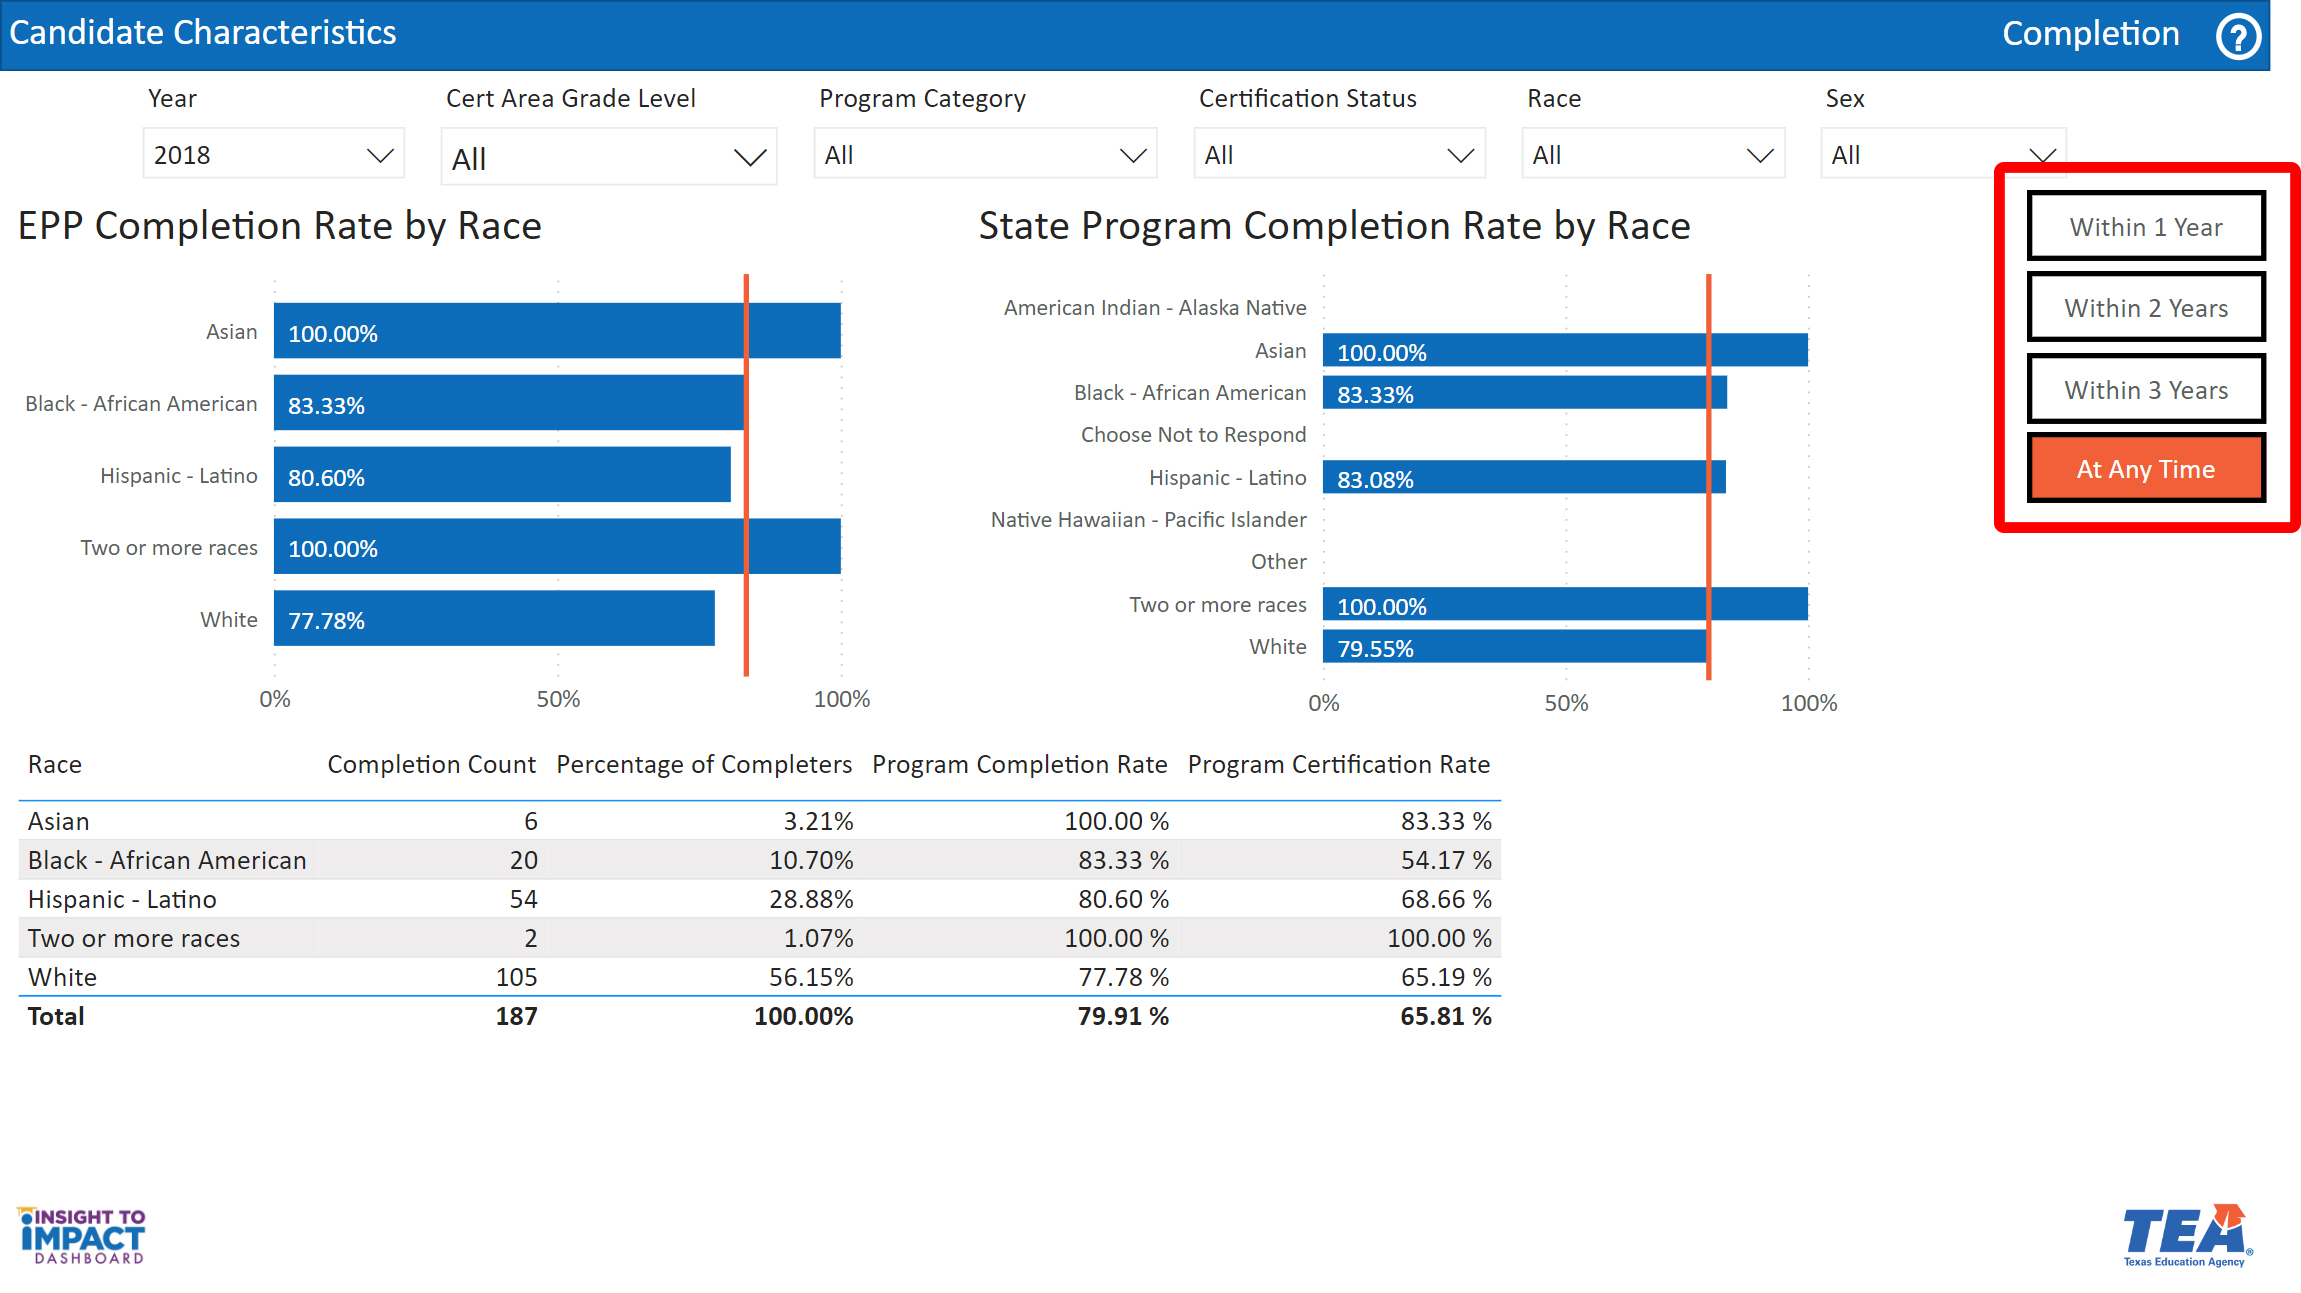
Select Completion Rate within a specific timeframe
Use the buttons on the right of the page to select a completion rate time frame within 1 Year, 2 Years, 3 Years, or At Any Time.
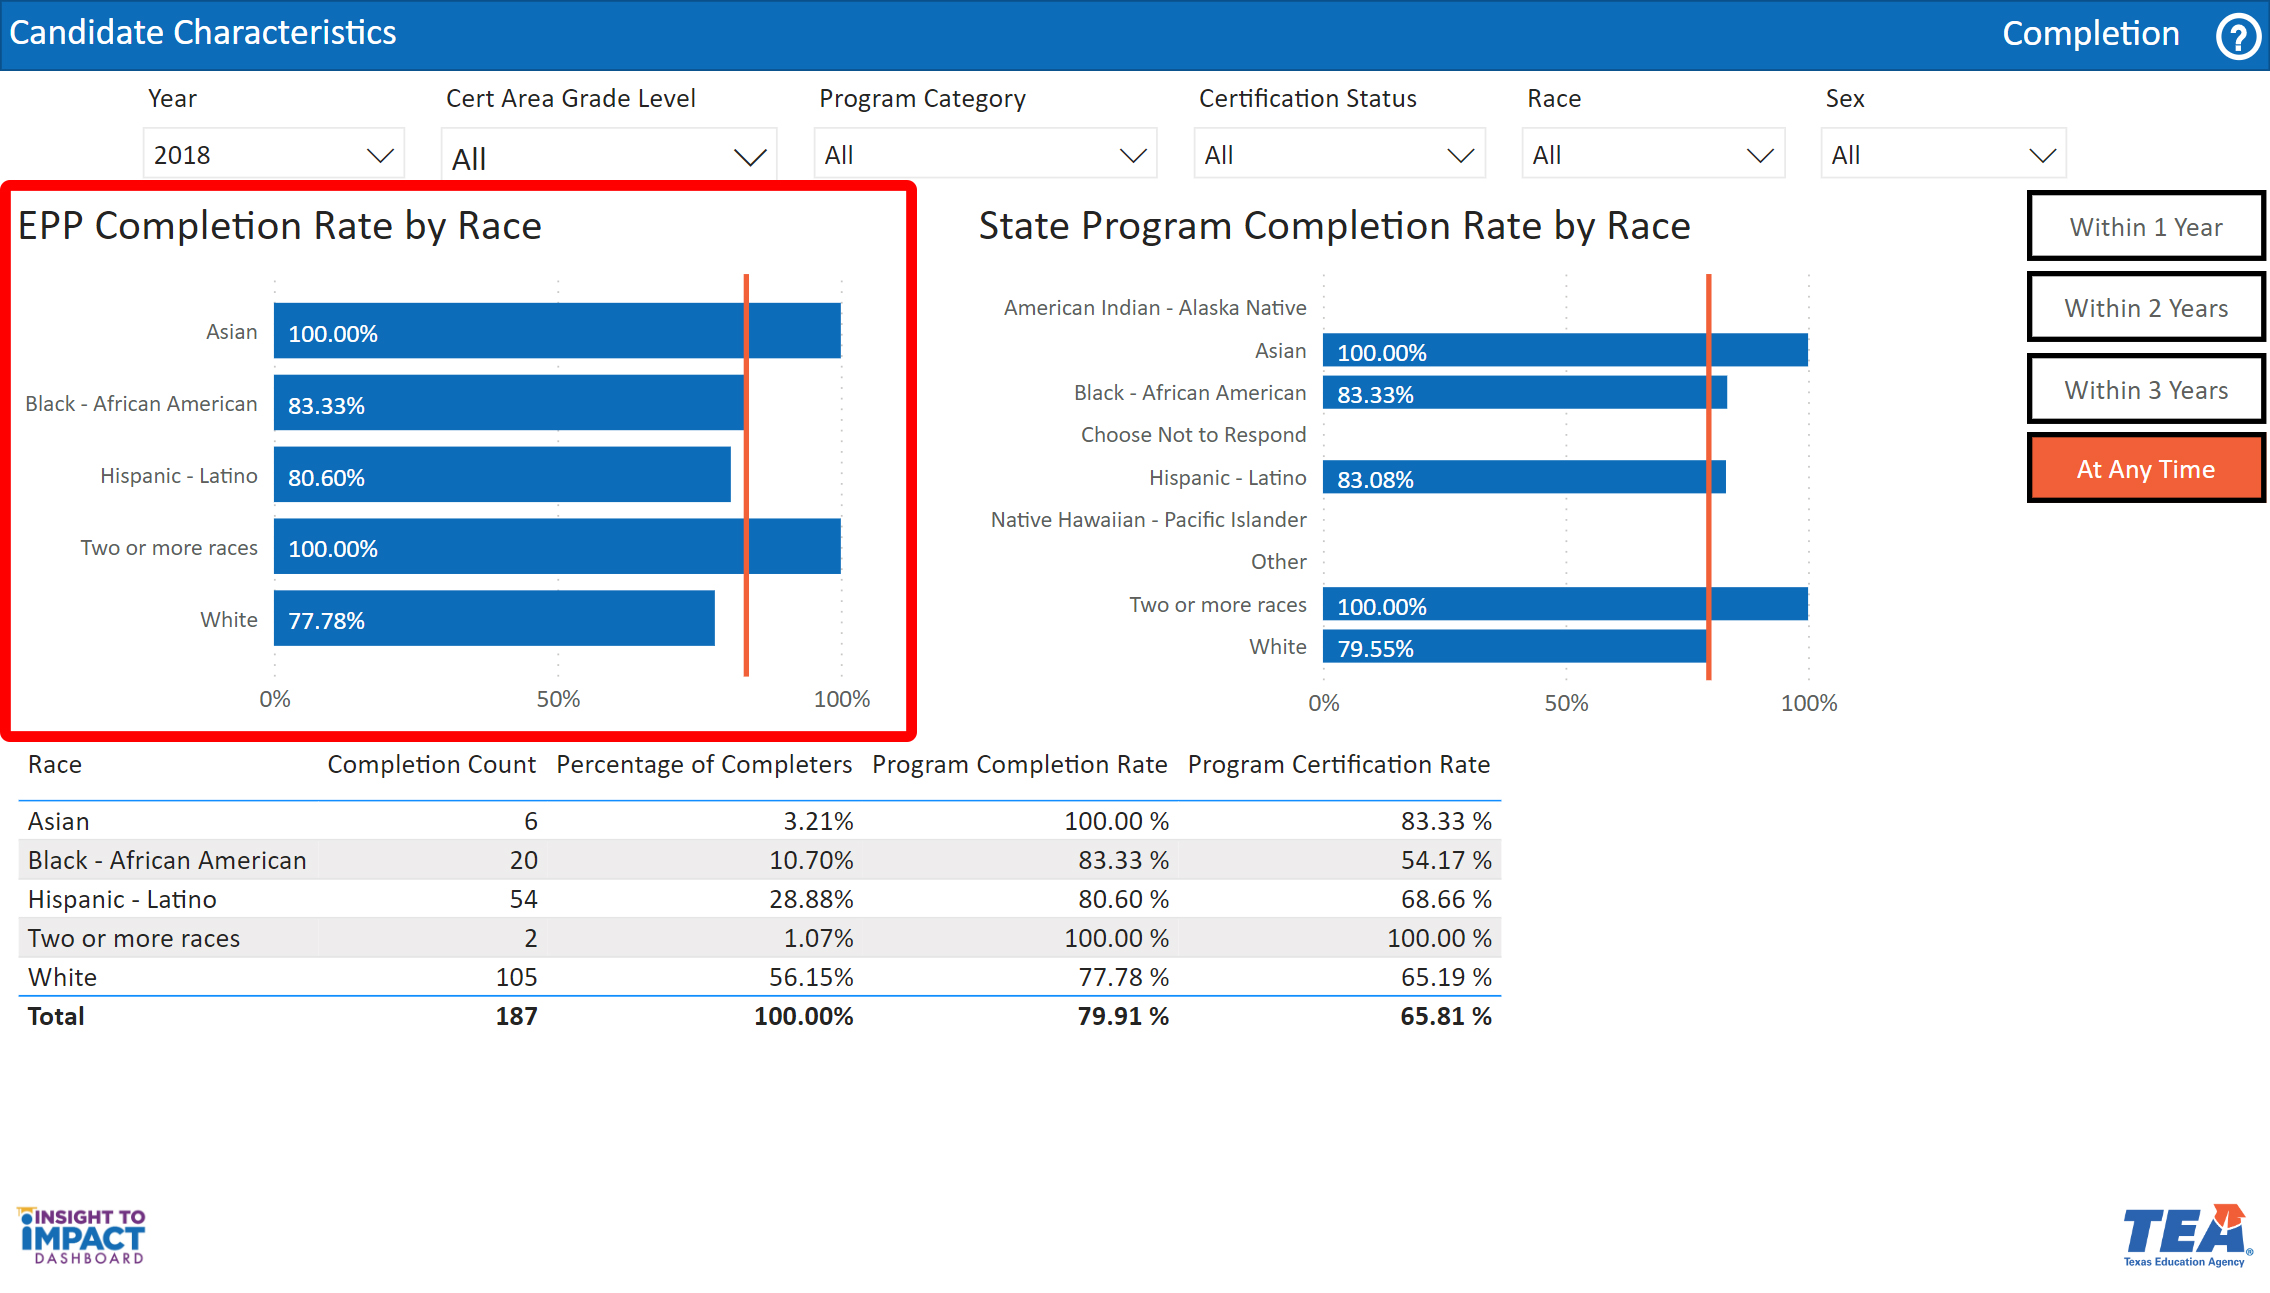
View EPP Completion Rates by Race/Ethnicity
The first visual is titled, “EPP Completion Rate by Race.” This bar graph indicates the percentage of candidate completion rates by race for your EPP. This view will change based on your selected filters and selection of completion rate with a specific timeframe.
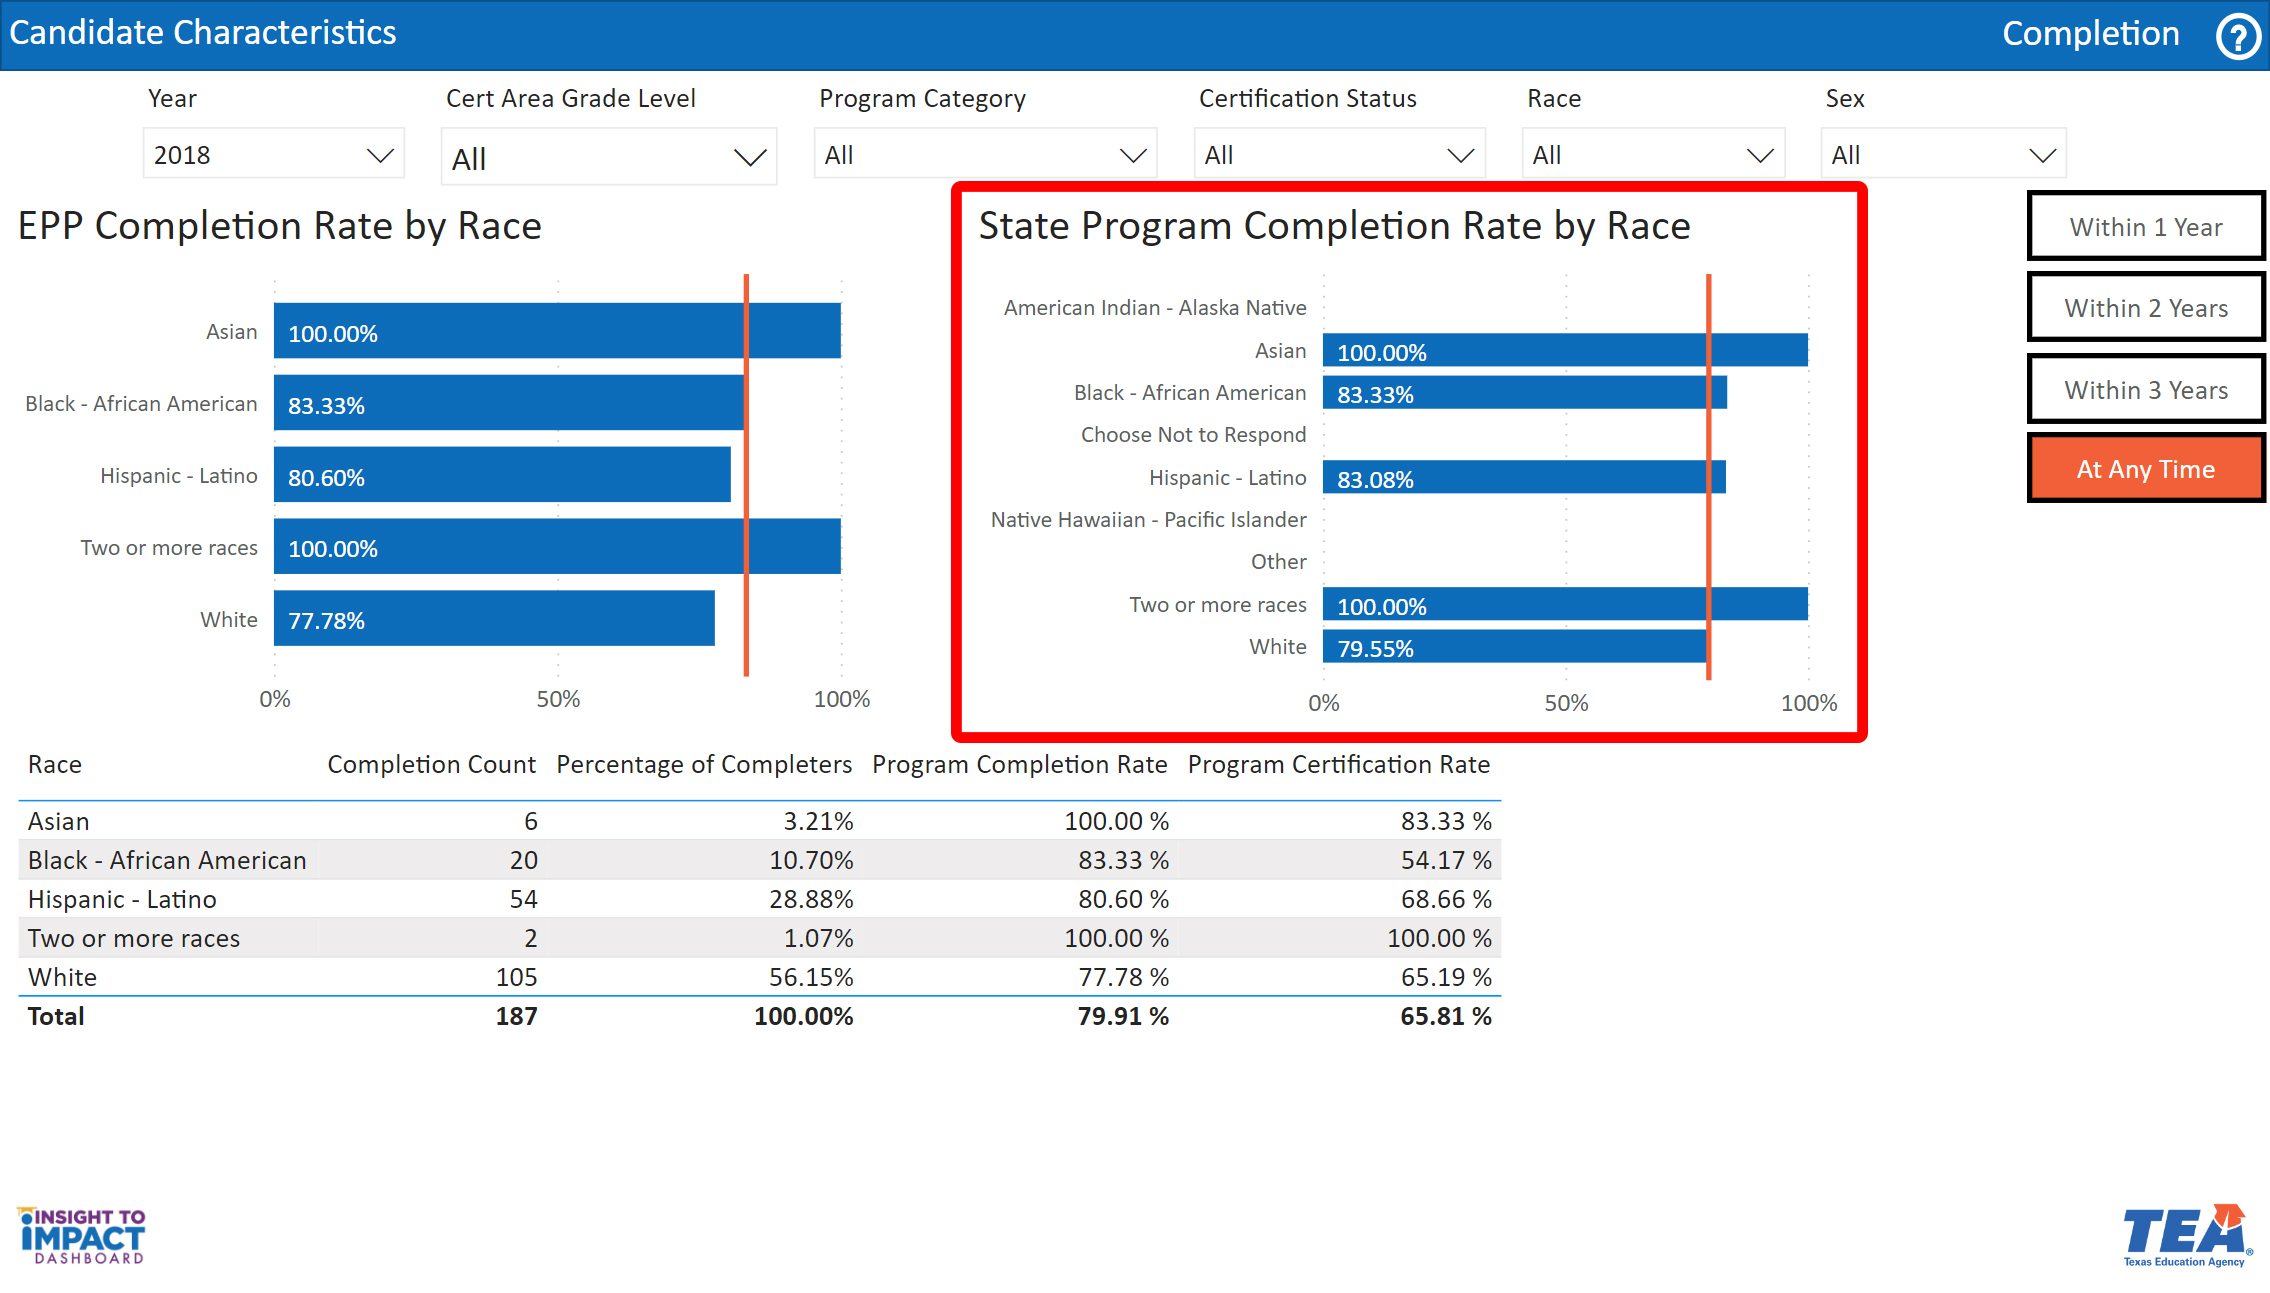
View the State Program Completion Rate by Race/Ethnicity
The second visual is titled “State Program Completion Rate by Race.” This bar graph indicates the percentages of completion rates by race statewide for your EPP. This view will change based on your selected filters and selection of completion rate with a specific timeframe.
Use the Completion Rates by Race table to view completion data for the EPP
The third visual is a table of collected data by Race, Completion Count, Percentage of Completers, Program Completion Rate, and Program Certification Rate for your EPP. This view will change based on your selected filters and selection of completion rate with a specific timeframe. You can view the data in the table in ascending or descending order by clicking a column title.

