Candidate Employment
Find details on the number of certified and LEA-employed candidates for your EPP, LEA placement details, certification grade levels and subject areas, teaching grade levels and subject areas, and candidate demographics.
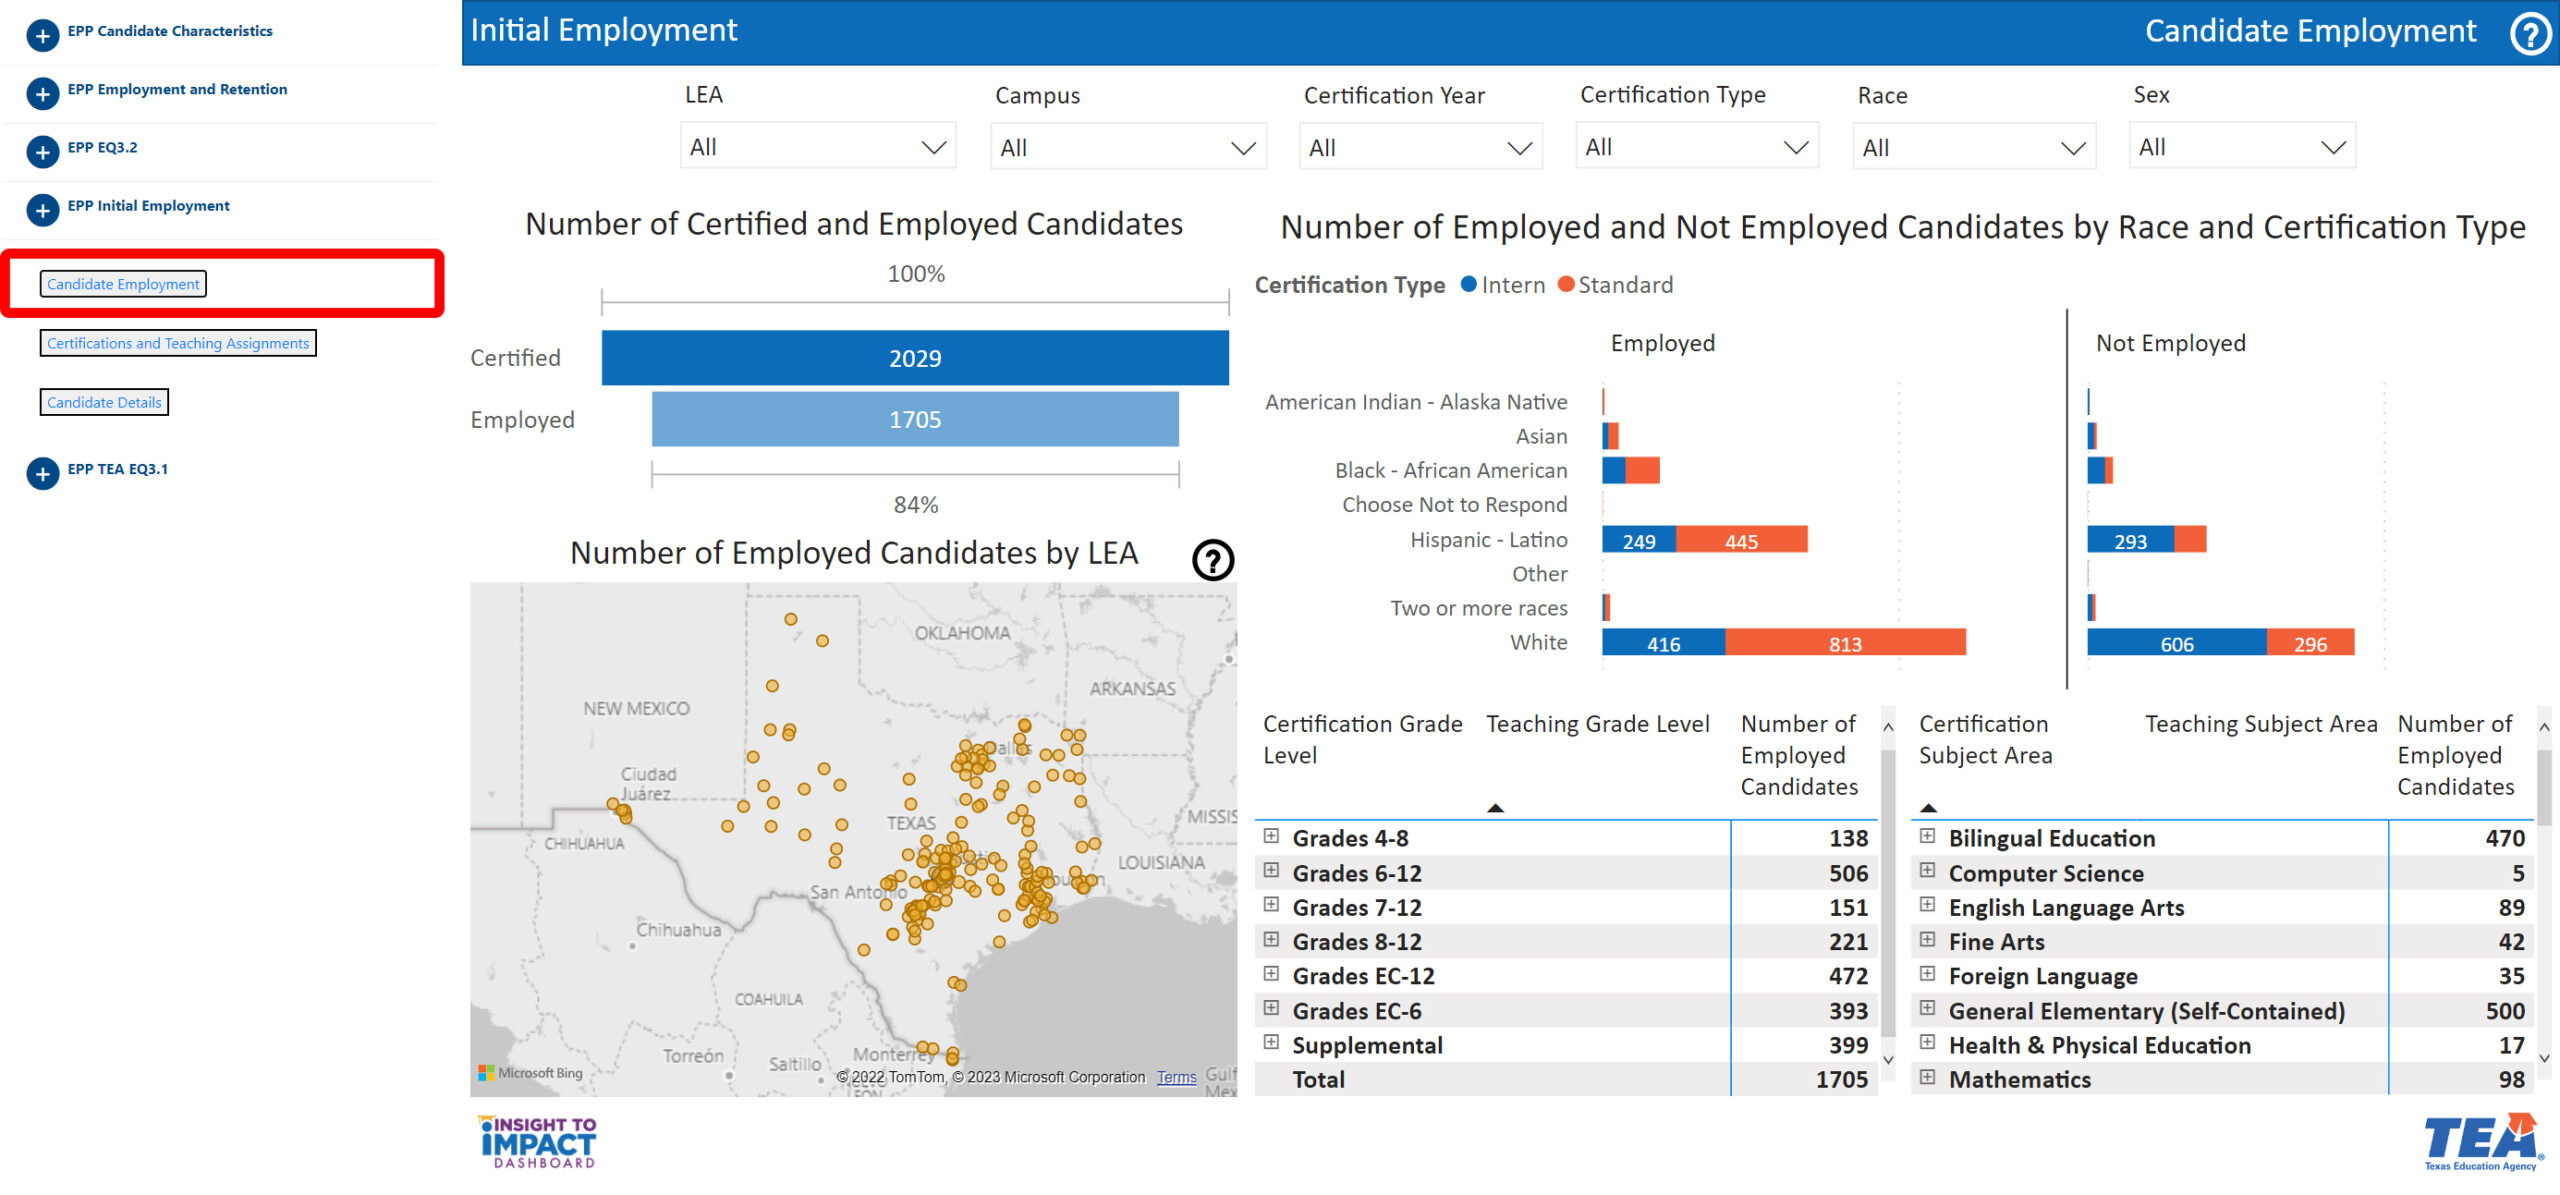
Navigate to Candidate Employment
Select “Candidate Employment” from the menu. On this page, you will be able to filter data according to LEA, Campus, Certification Year, Certification Type, Race, and Gender.
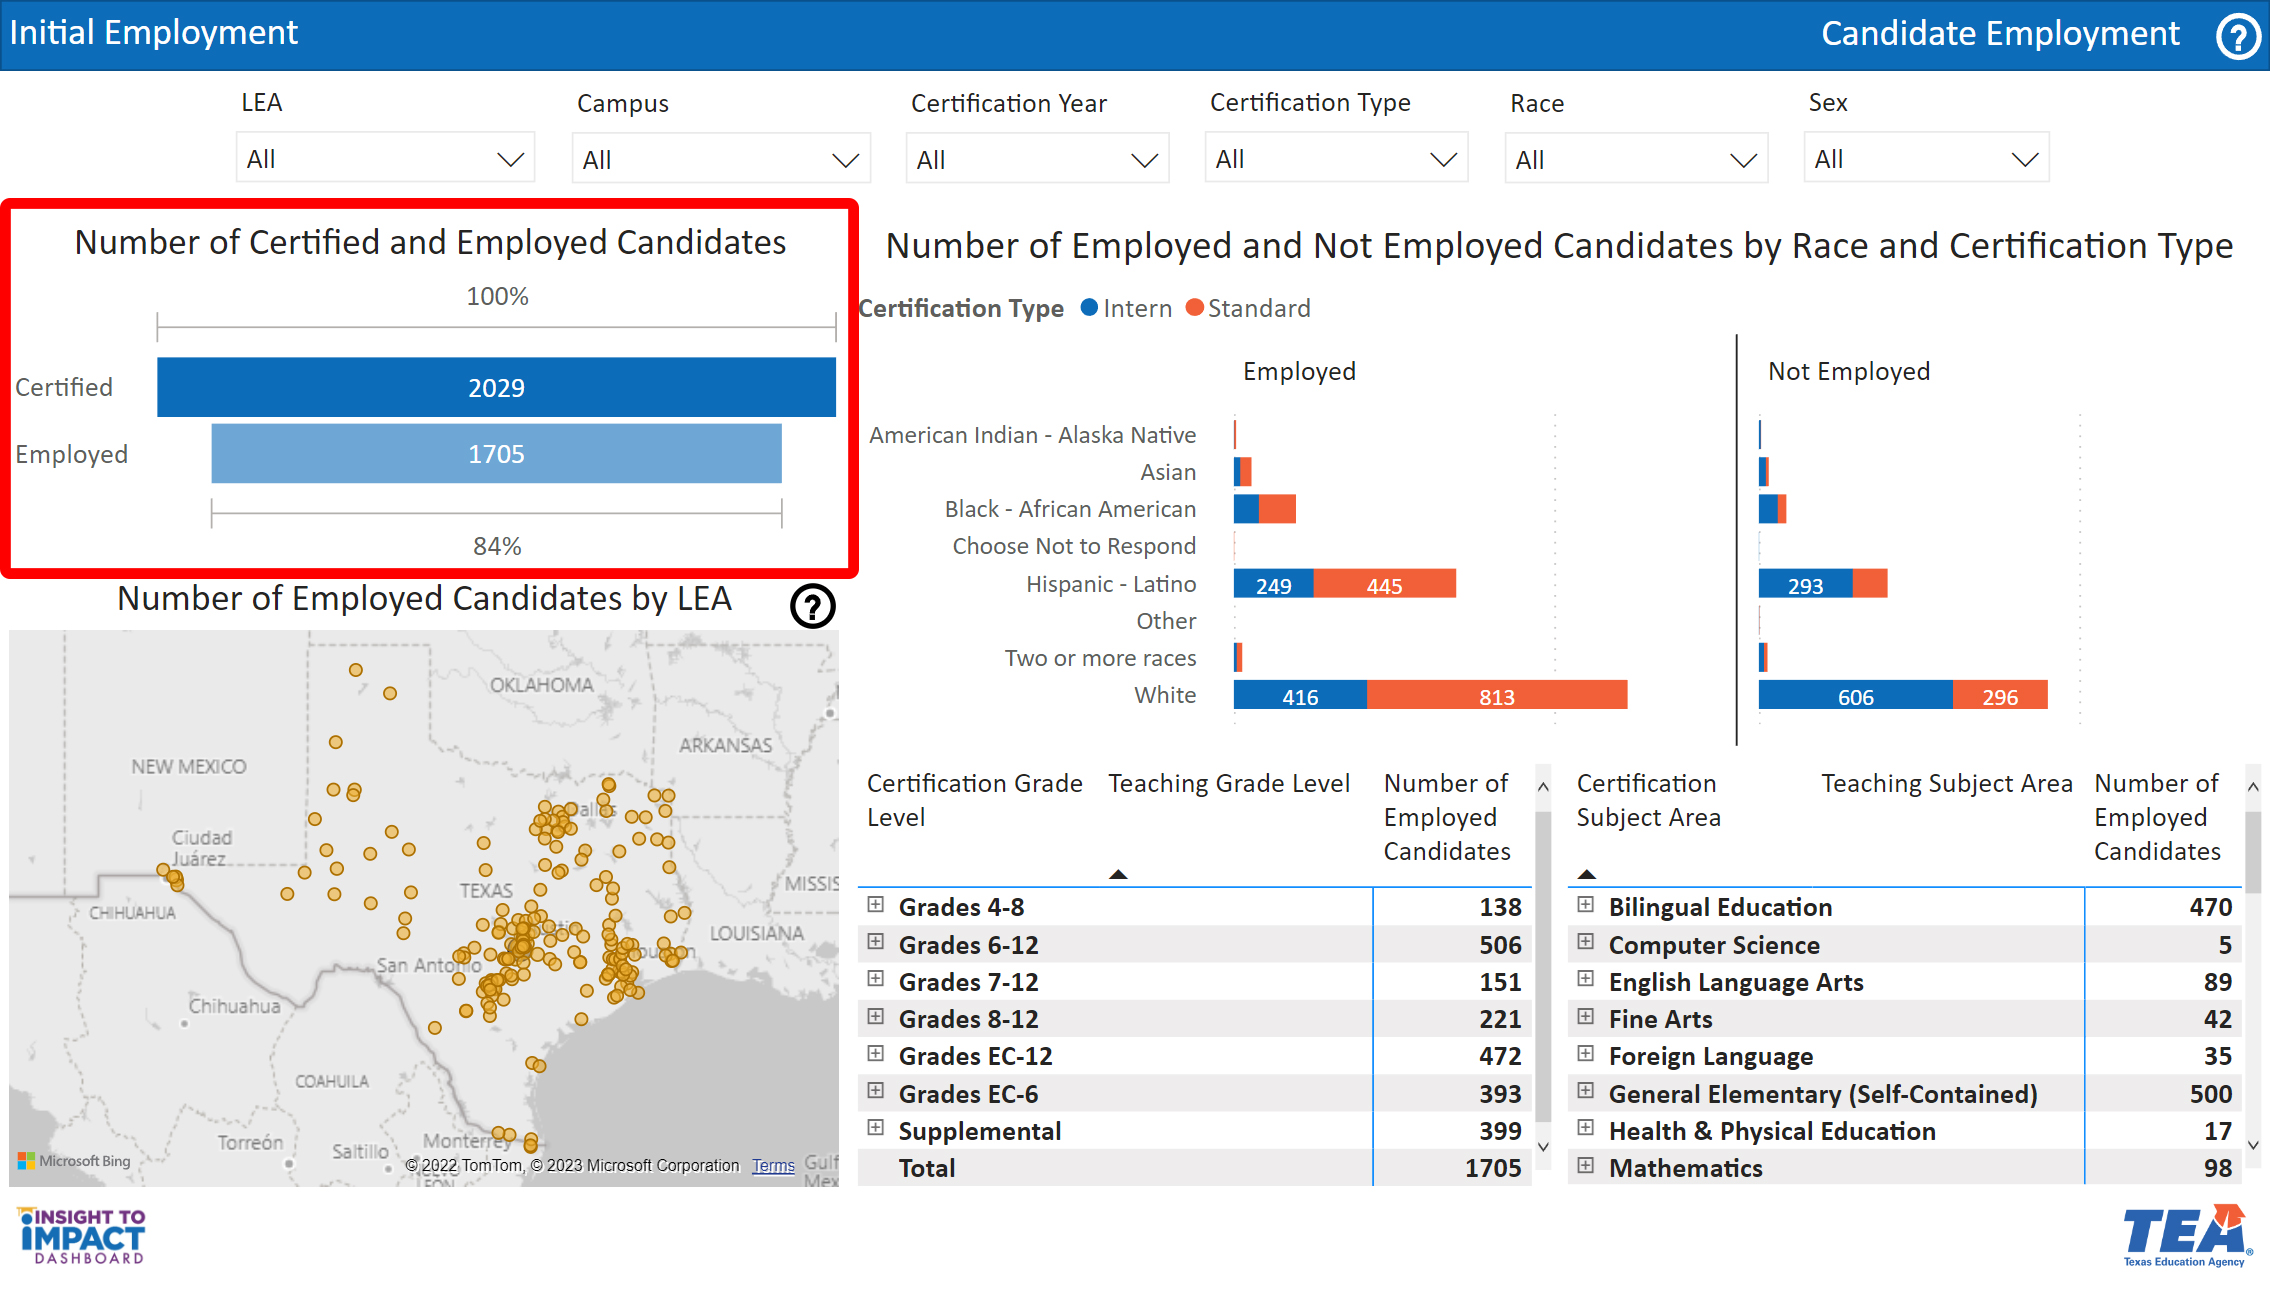
View the Number of Certified and Employed Candidates
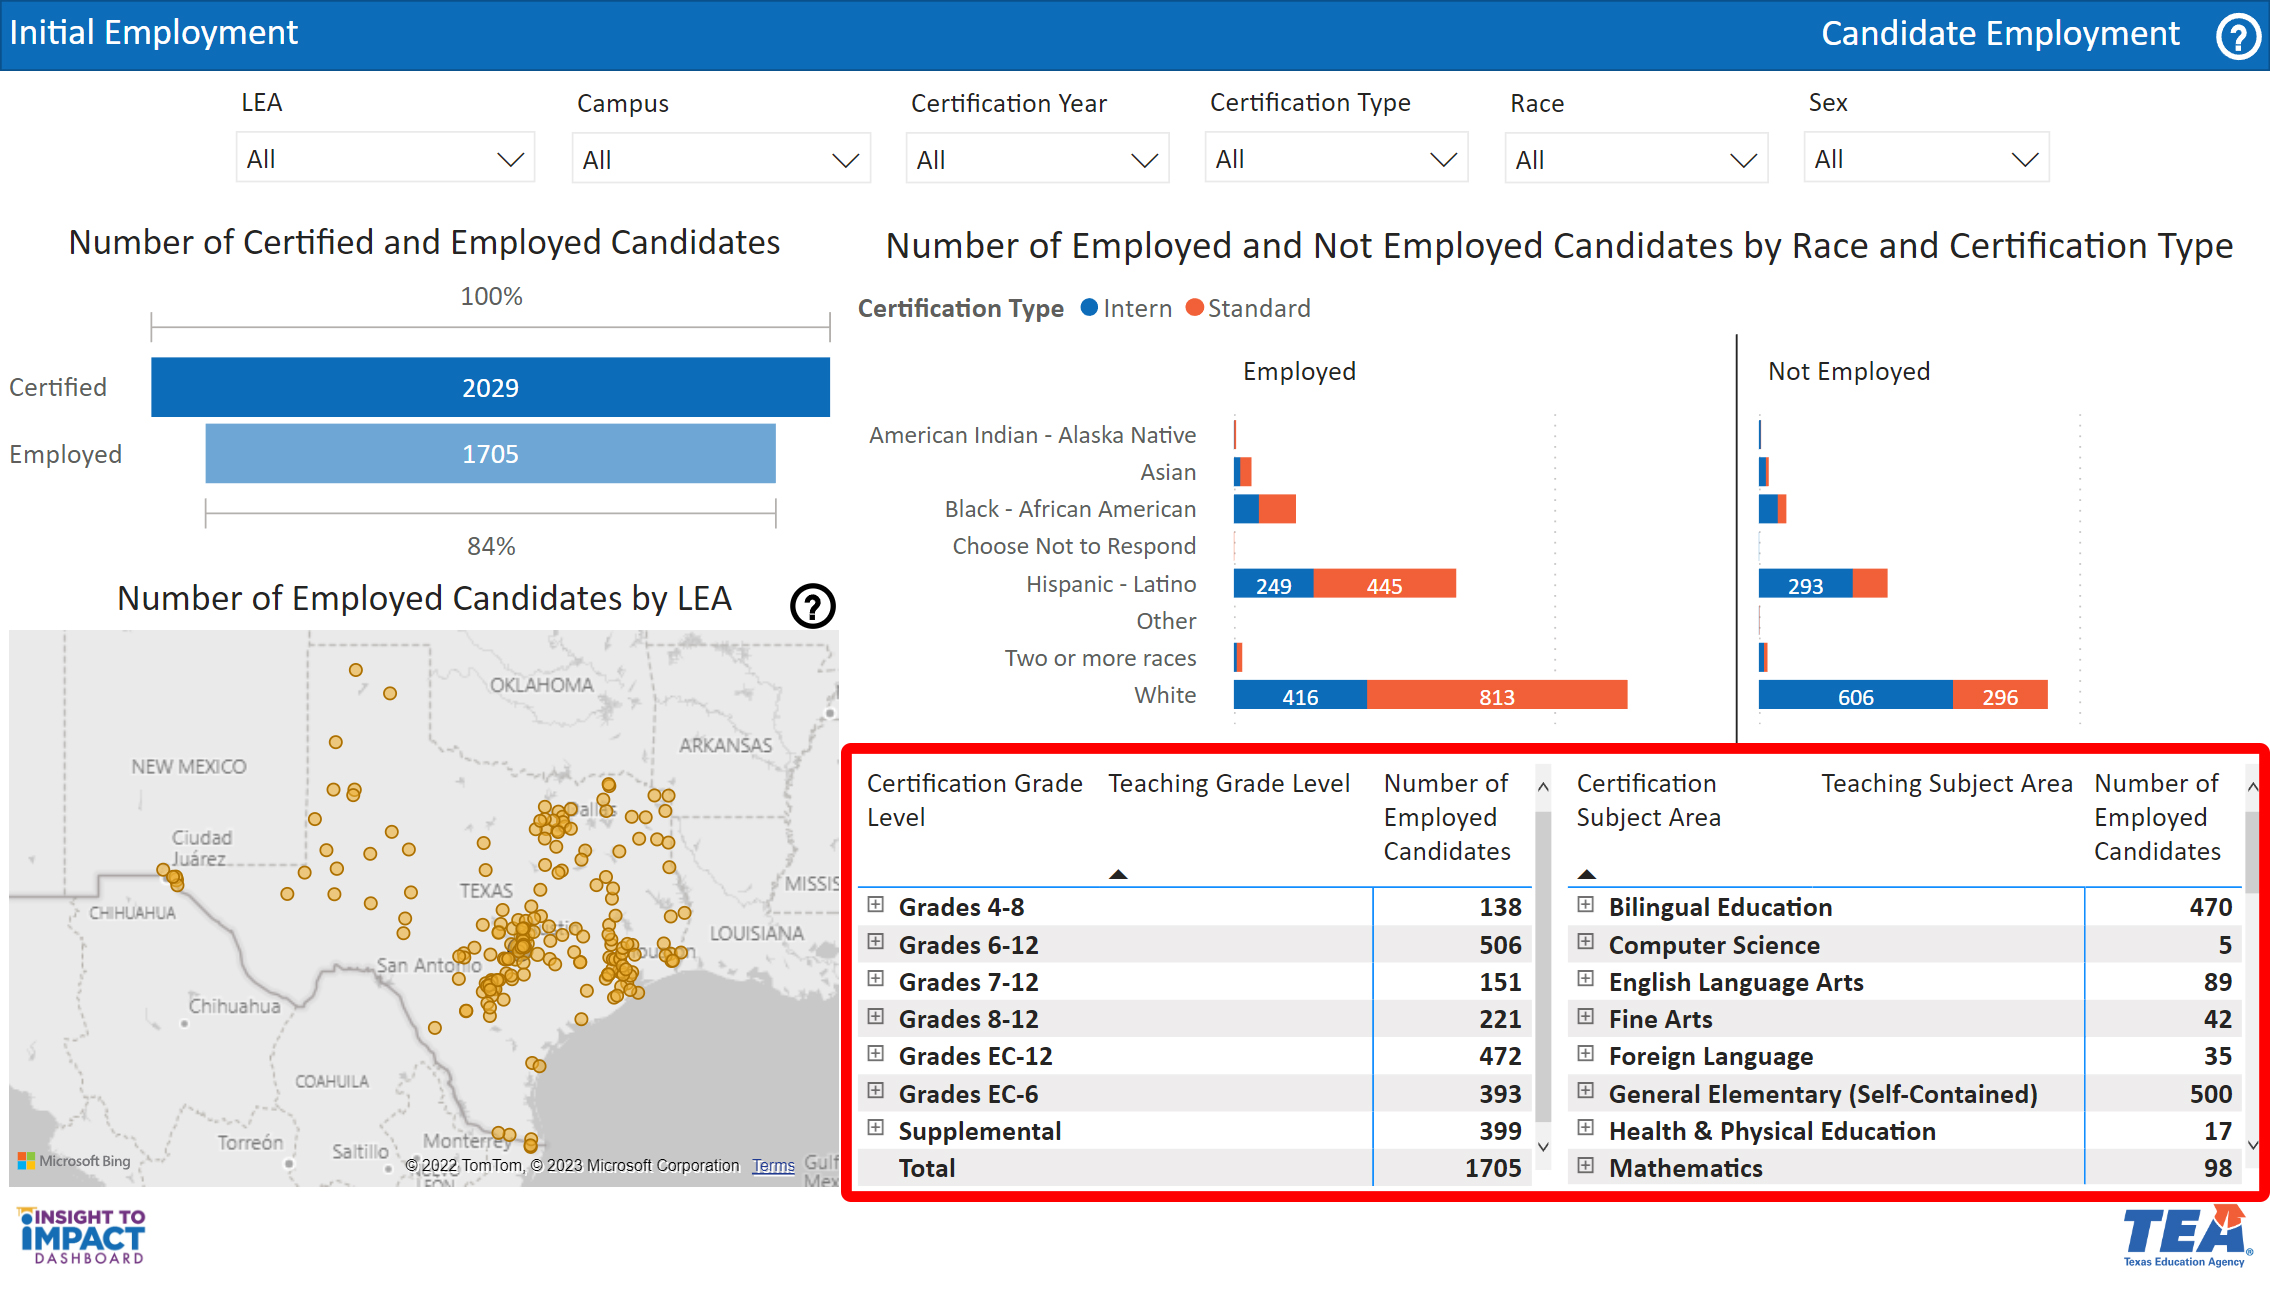
The first visual is titled “Number of Certified and Employed Candidates.” The bar graph indicates the number of certified candidates and number of candidates who are employed within a Local Education Agency (LEA) for your EPP. This view will change based on your selected filters.
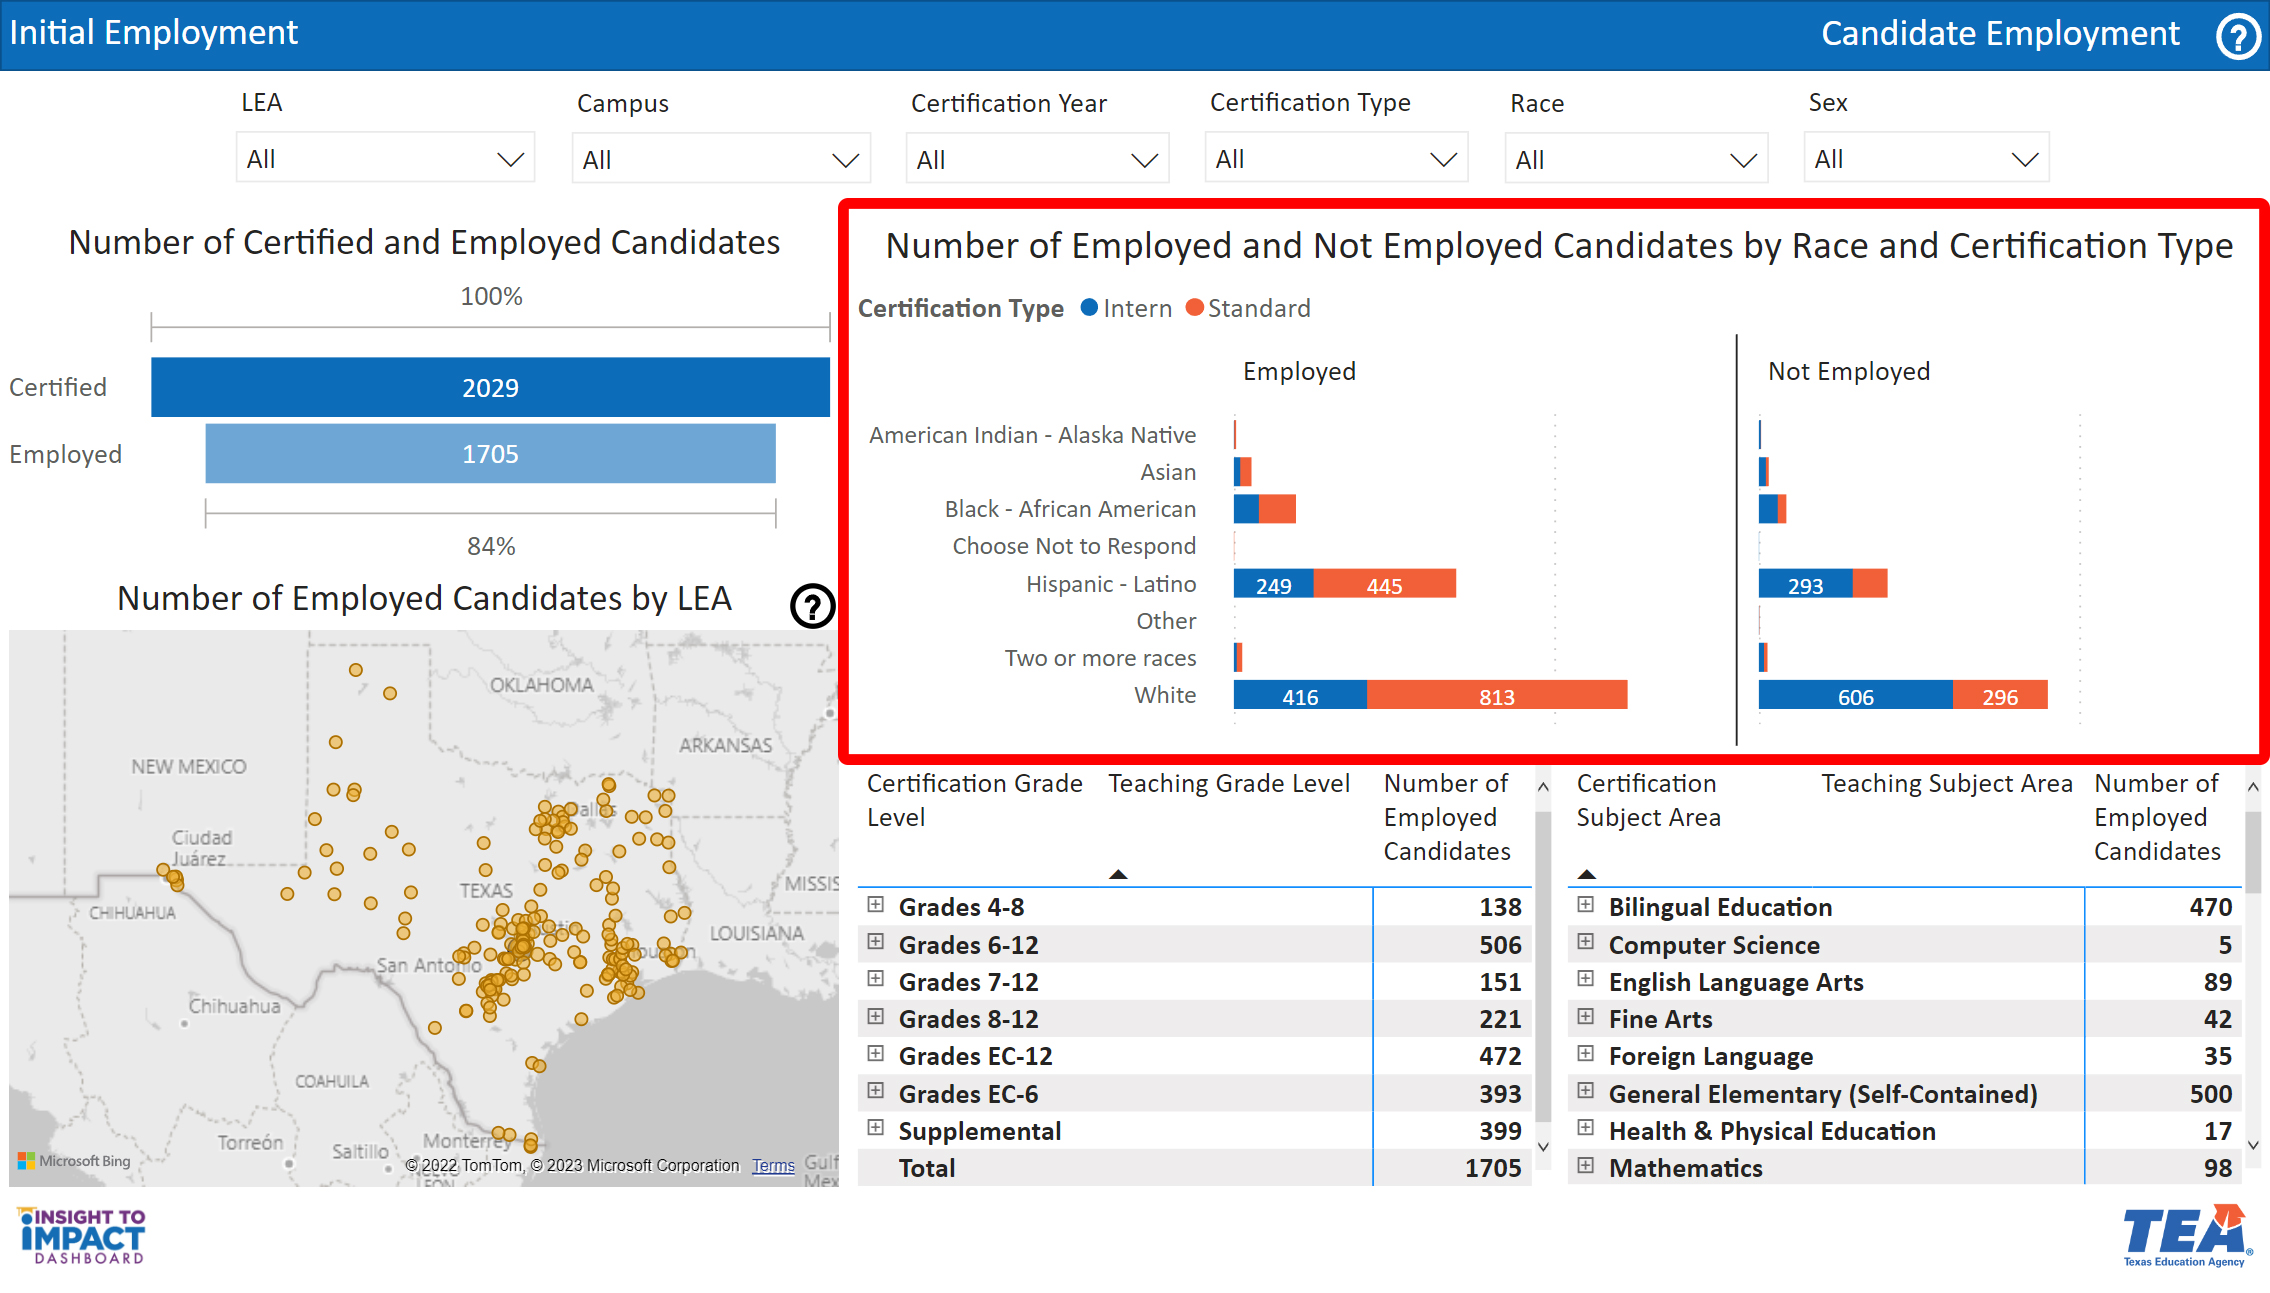
View the Number of Employed and Not Employed Candidates by Race and Certification Type
The second visual is titled “Number of Employed and Not Employed Candidates by Race and Certification Type.” This bar graph indicates the number of employed and not employed candidates by race and certification type for your EPP. This view will change based on your selected filters.
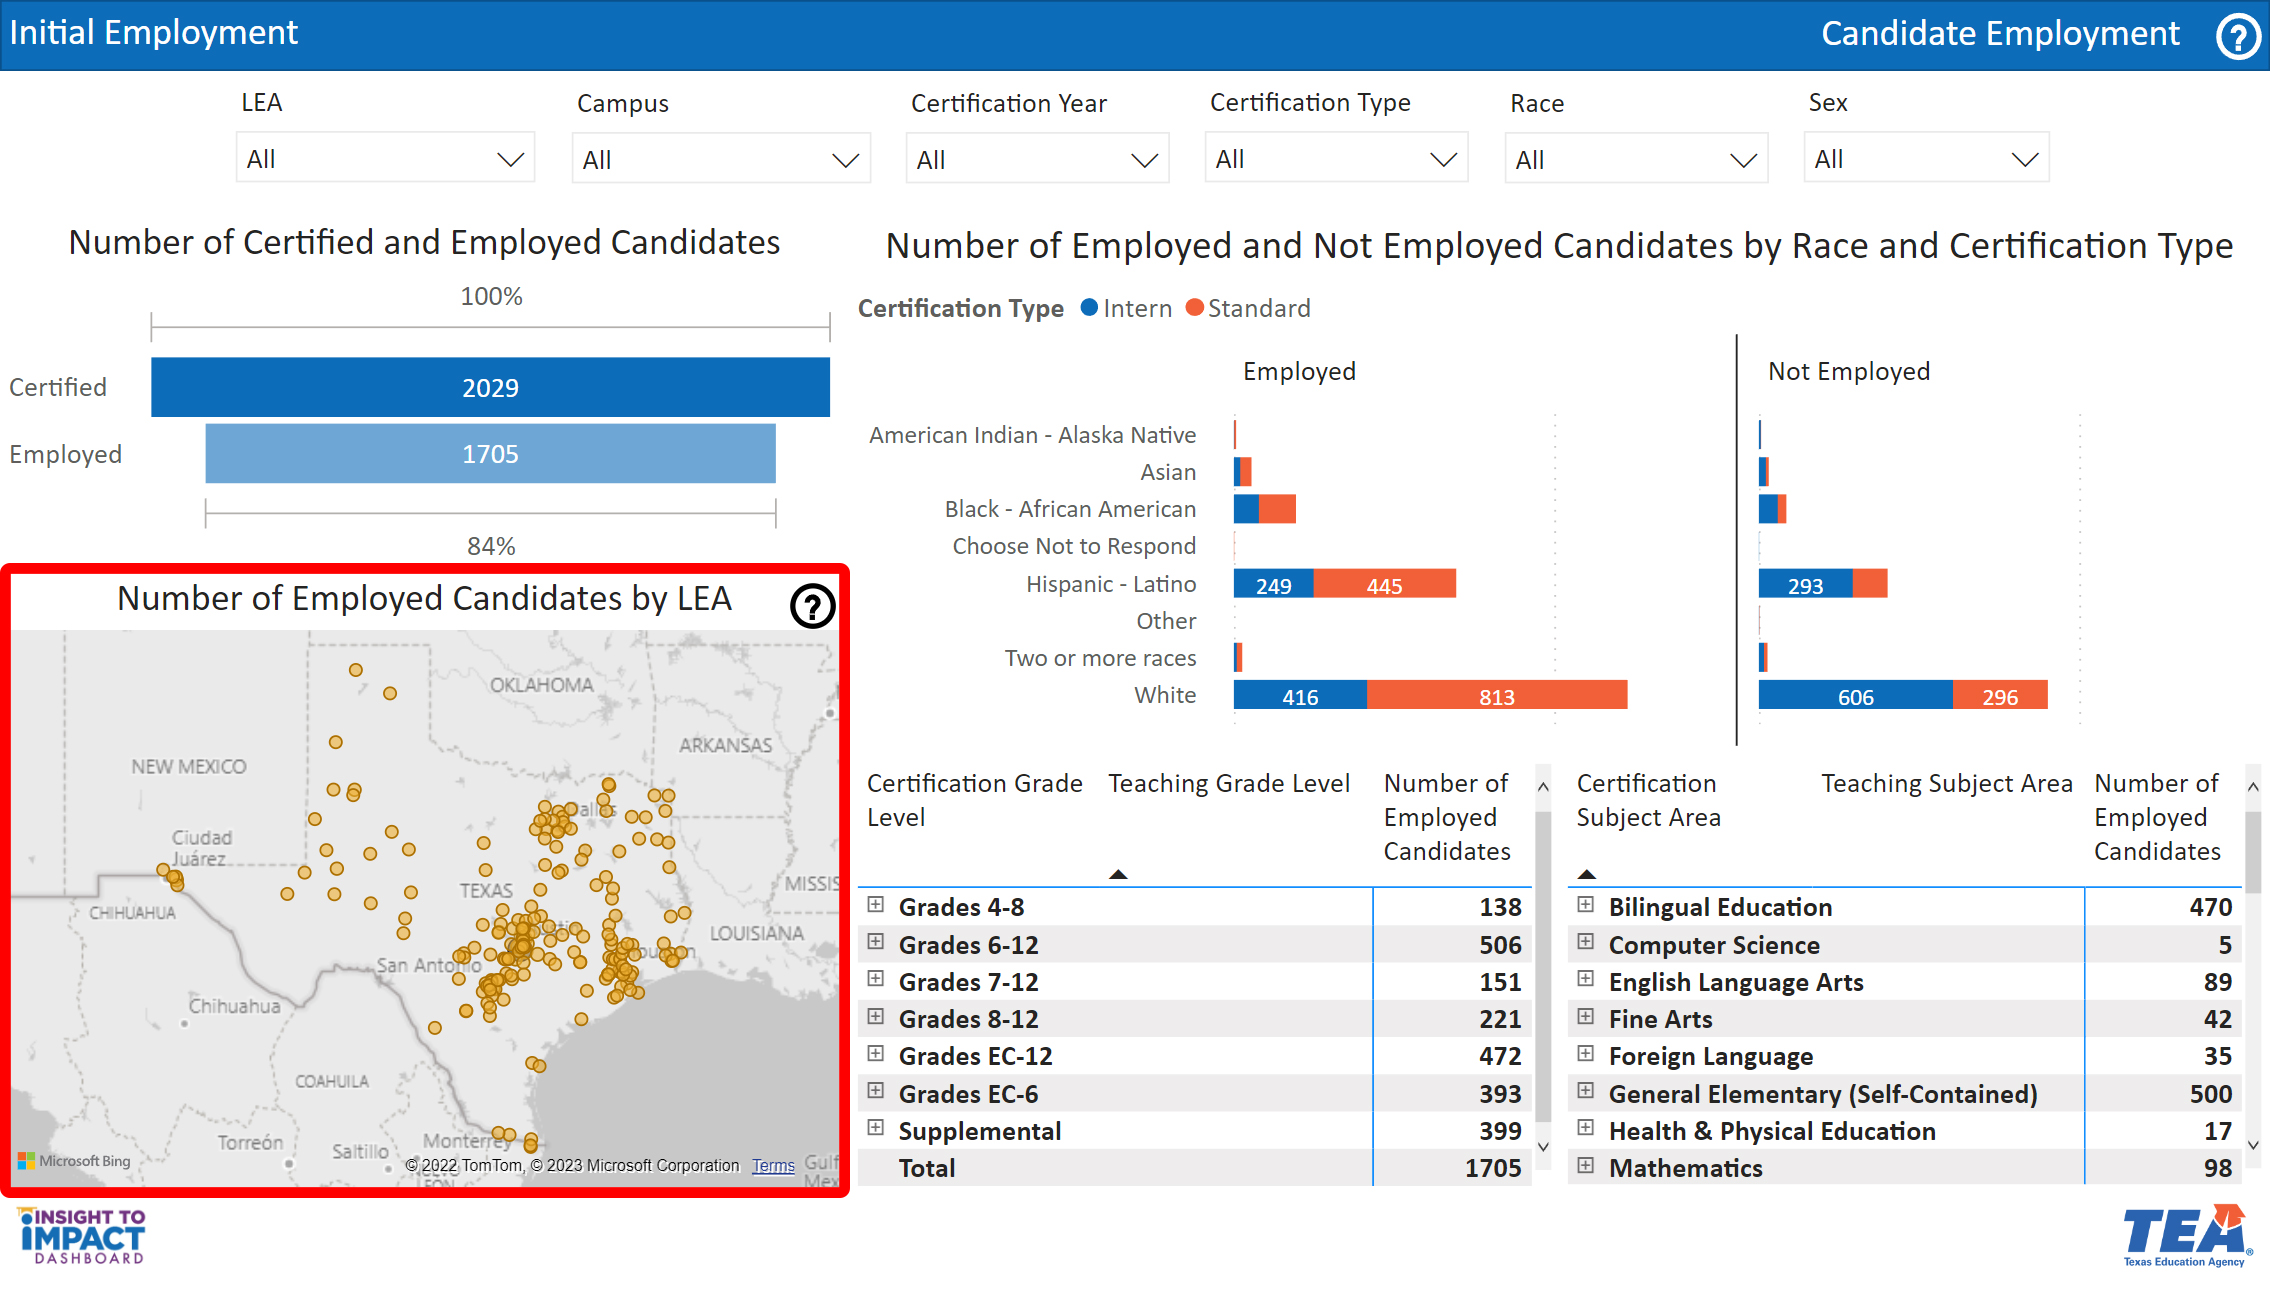
View the Number of Employed Candidates by LEA
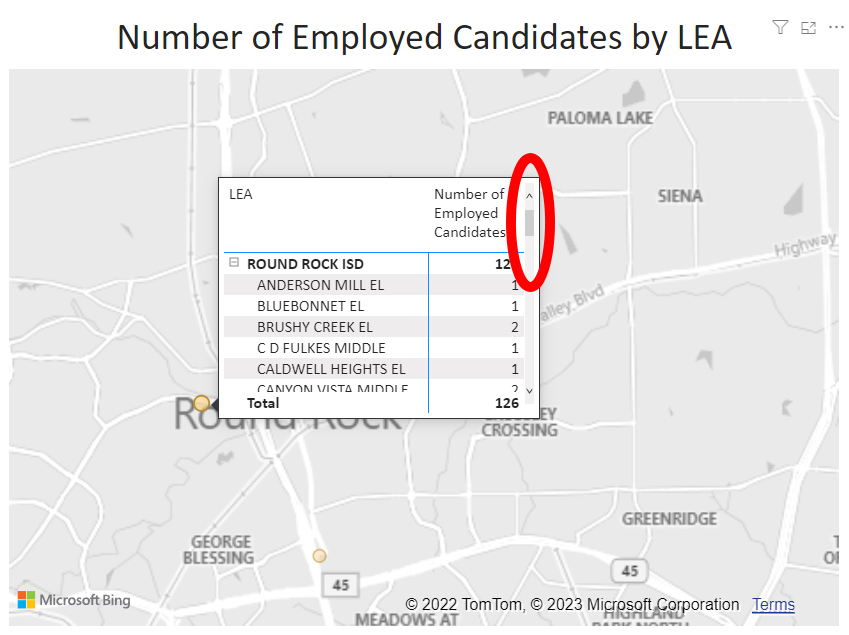
The third visual is titled “Number of Employed Candidates by LEA.” This map indicates the location and number of candidates employed at LEAs and campuses for your EPP. This view will change based on your selected filters.
- Double-click on the map or use the “plus” key on your keyboard to zoom in. To zoom out, use the “minus” key on your keyboard.
- “Click” and drag your mouse to move the map in the screen window.
- The number of educators employed from your EPP, and the year of employment. (In this example, the map is zoomed in to Round Rock ISD, and the pop-up LEA chart lists elementary schools in the district and the number of employed candidates at each campus. For the pop-up LEA chart, you may need to use the scroll bar on the right to view all of the campuses.)
View the Certification Grade Level and Subject Area chart
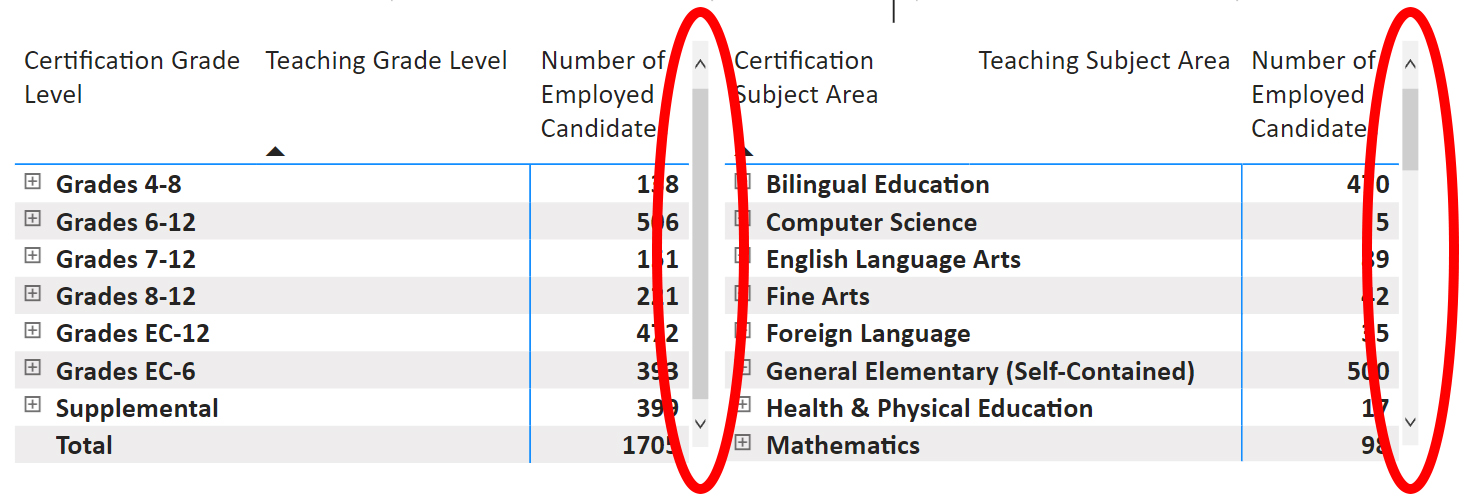
The fourth visual is titled “Certification Grade Level and Subject Area.” The chart indicates the number of employed candidates by grade level and by certification subject area for your EPP. This view will change based on your selected filters.
For the Certification Grade level, you may need to use the scroll bar on the right to view all of the grade levels.
For the Certification Subject Area, use the scroll bar to view the list of subjects.
Use the + or – signs next to a grade level or certification subject area to expand or collapse the list.

