Principal Perceptions by Construct
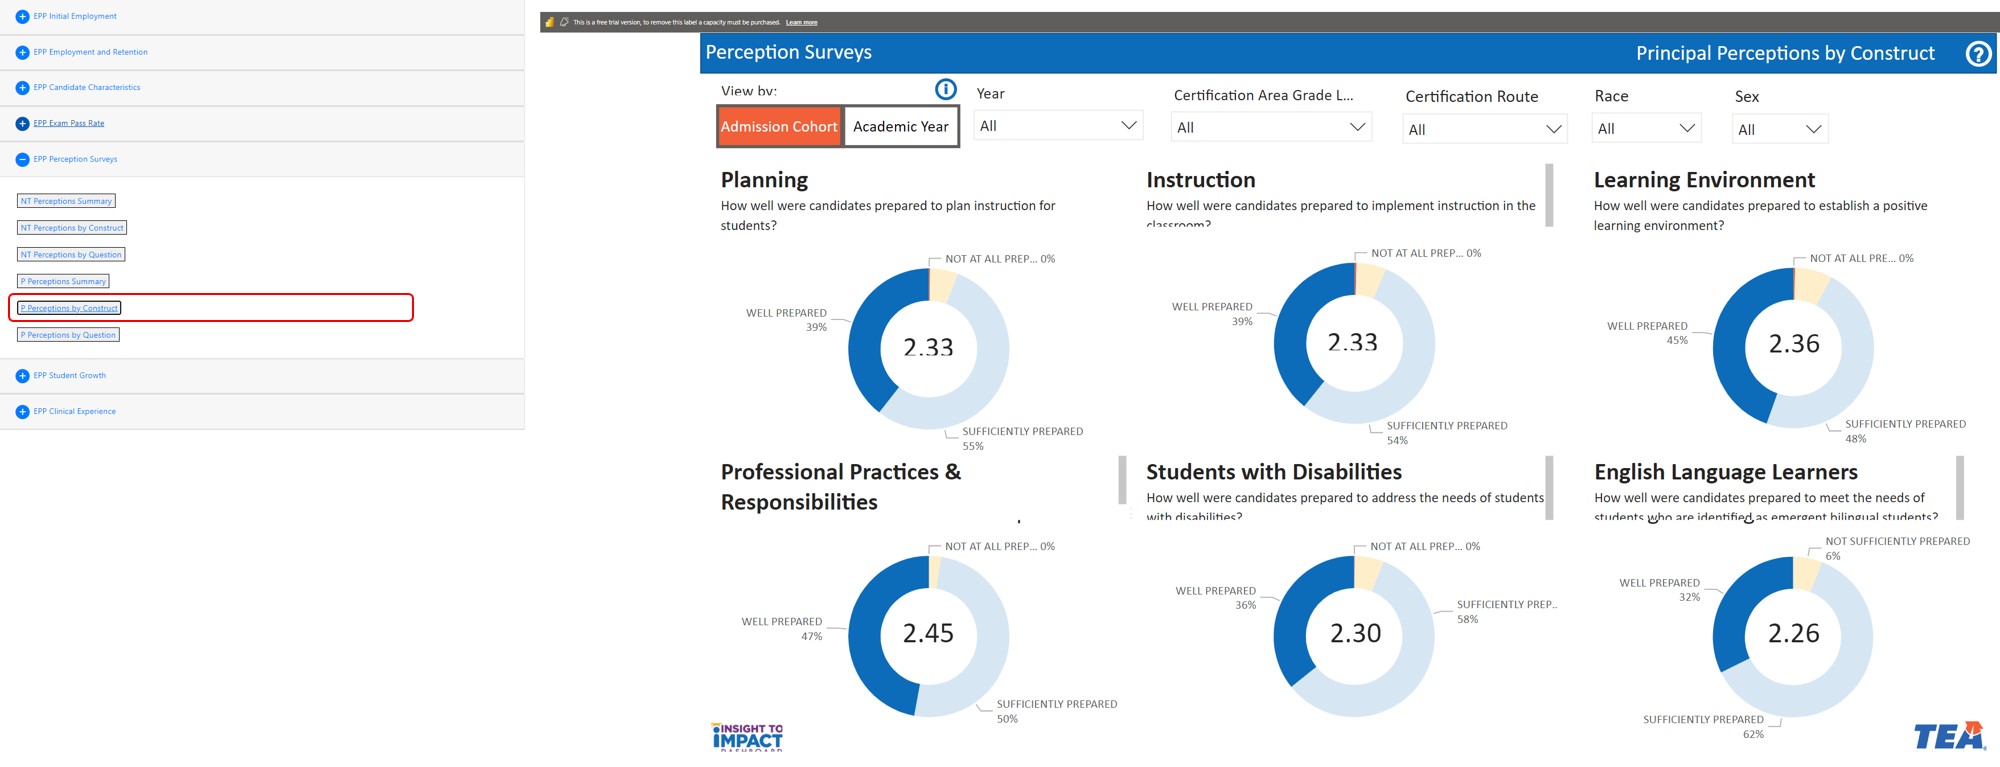
Details principal perception survey responses for new teachers from your EPP by admission cohort or academic year. Constructs for teacher preparation are related to planning, instruction, ability to build a positive learning environment, professional practices and responsibilities, preparation to teach students with disabilities, and preparation to English language learners.
Navigate to the Principal Perceptions by Construct Page
Select the “Principal Perceptions by Construct” page from the menu. On this page, you will be able to filter information by Year, Certification Area Grade Level, Certification Route, Race, and Sex.
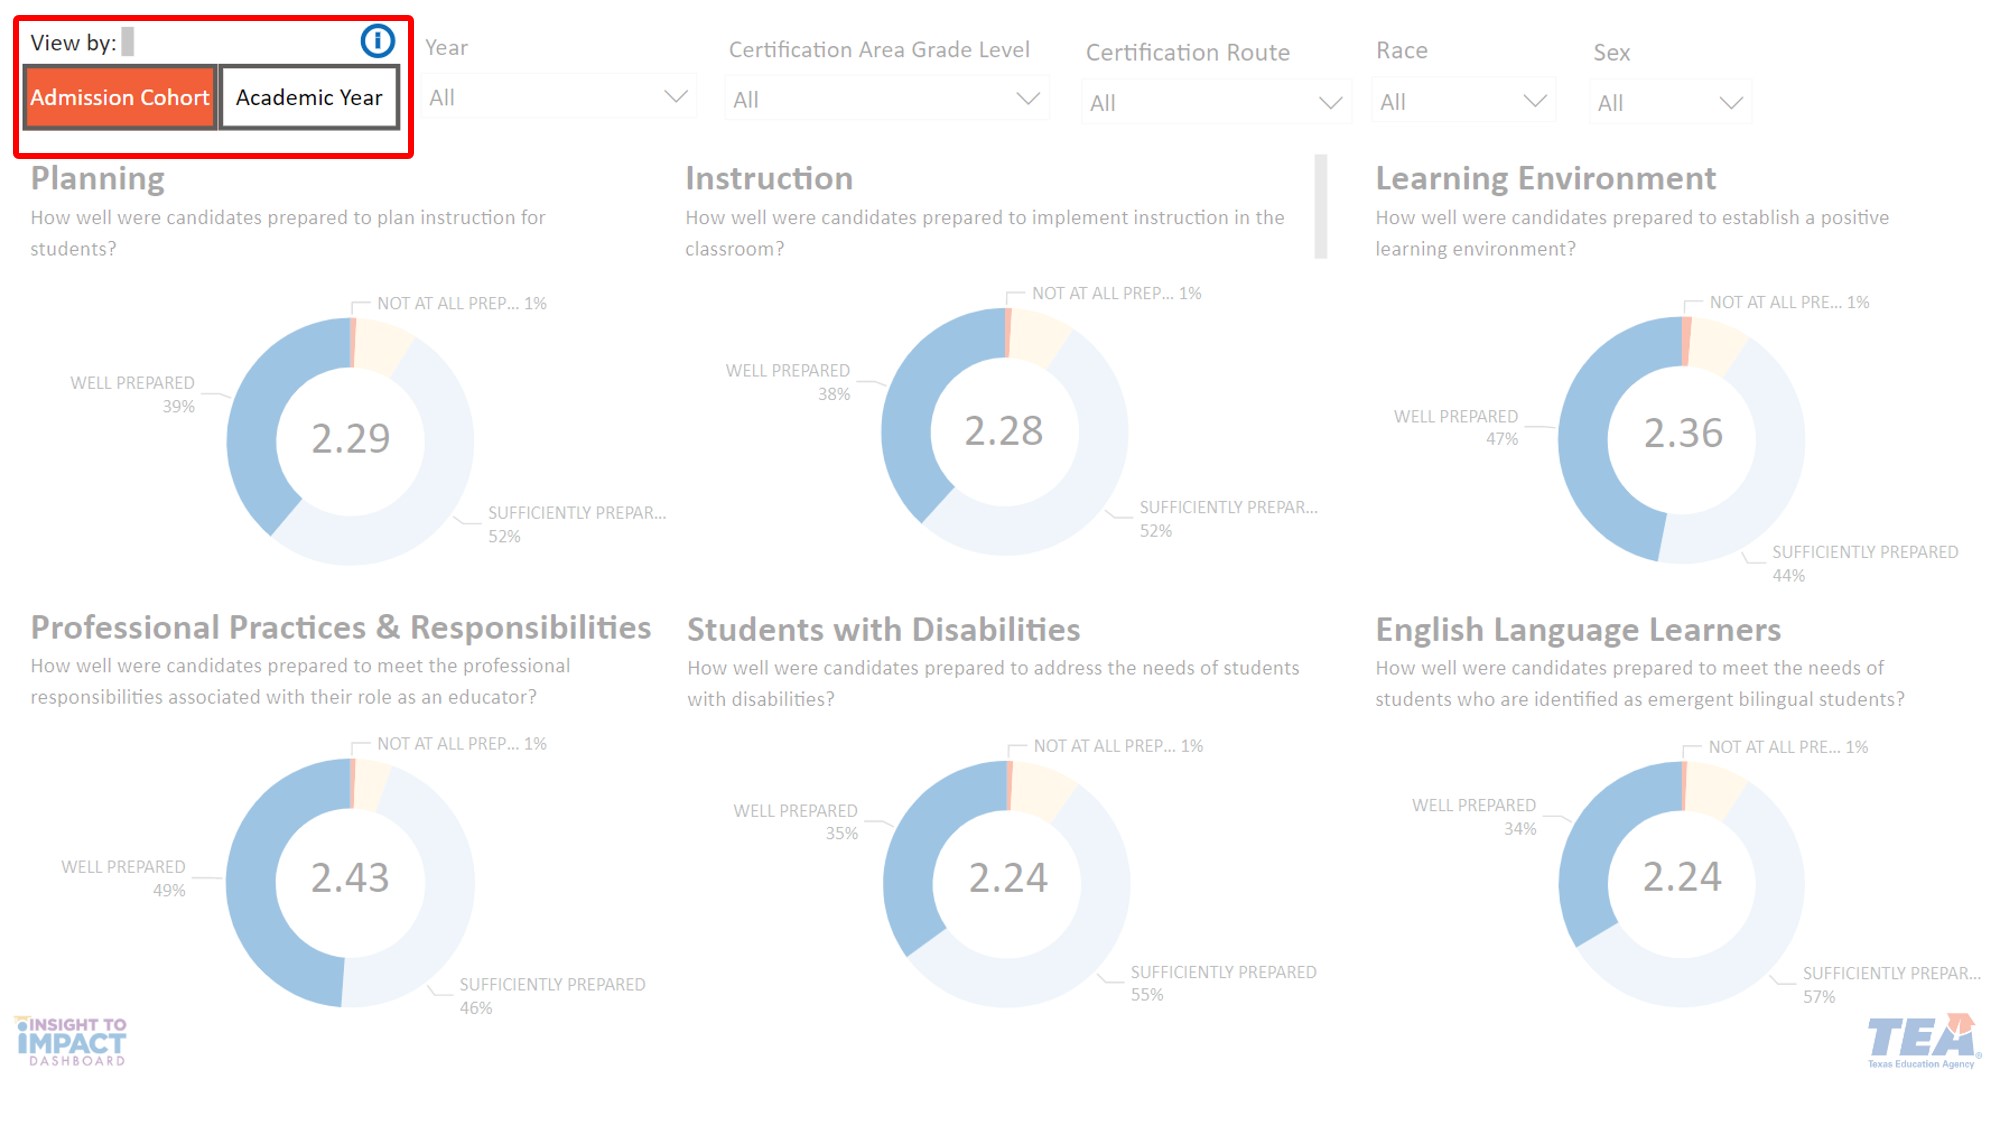
Select Admission Cohort or Academic Year
Use the Academic Cohort button to view exam pass rates for a specific Cohort or use the Academic Year button to view exam pass rates for a specific year.
View Principal Perceptions about Planning
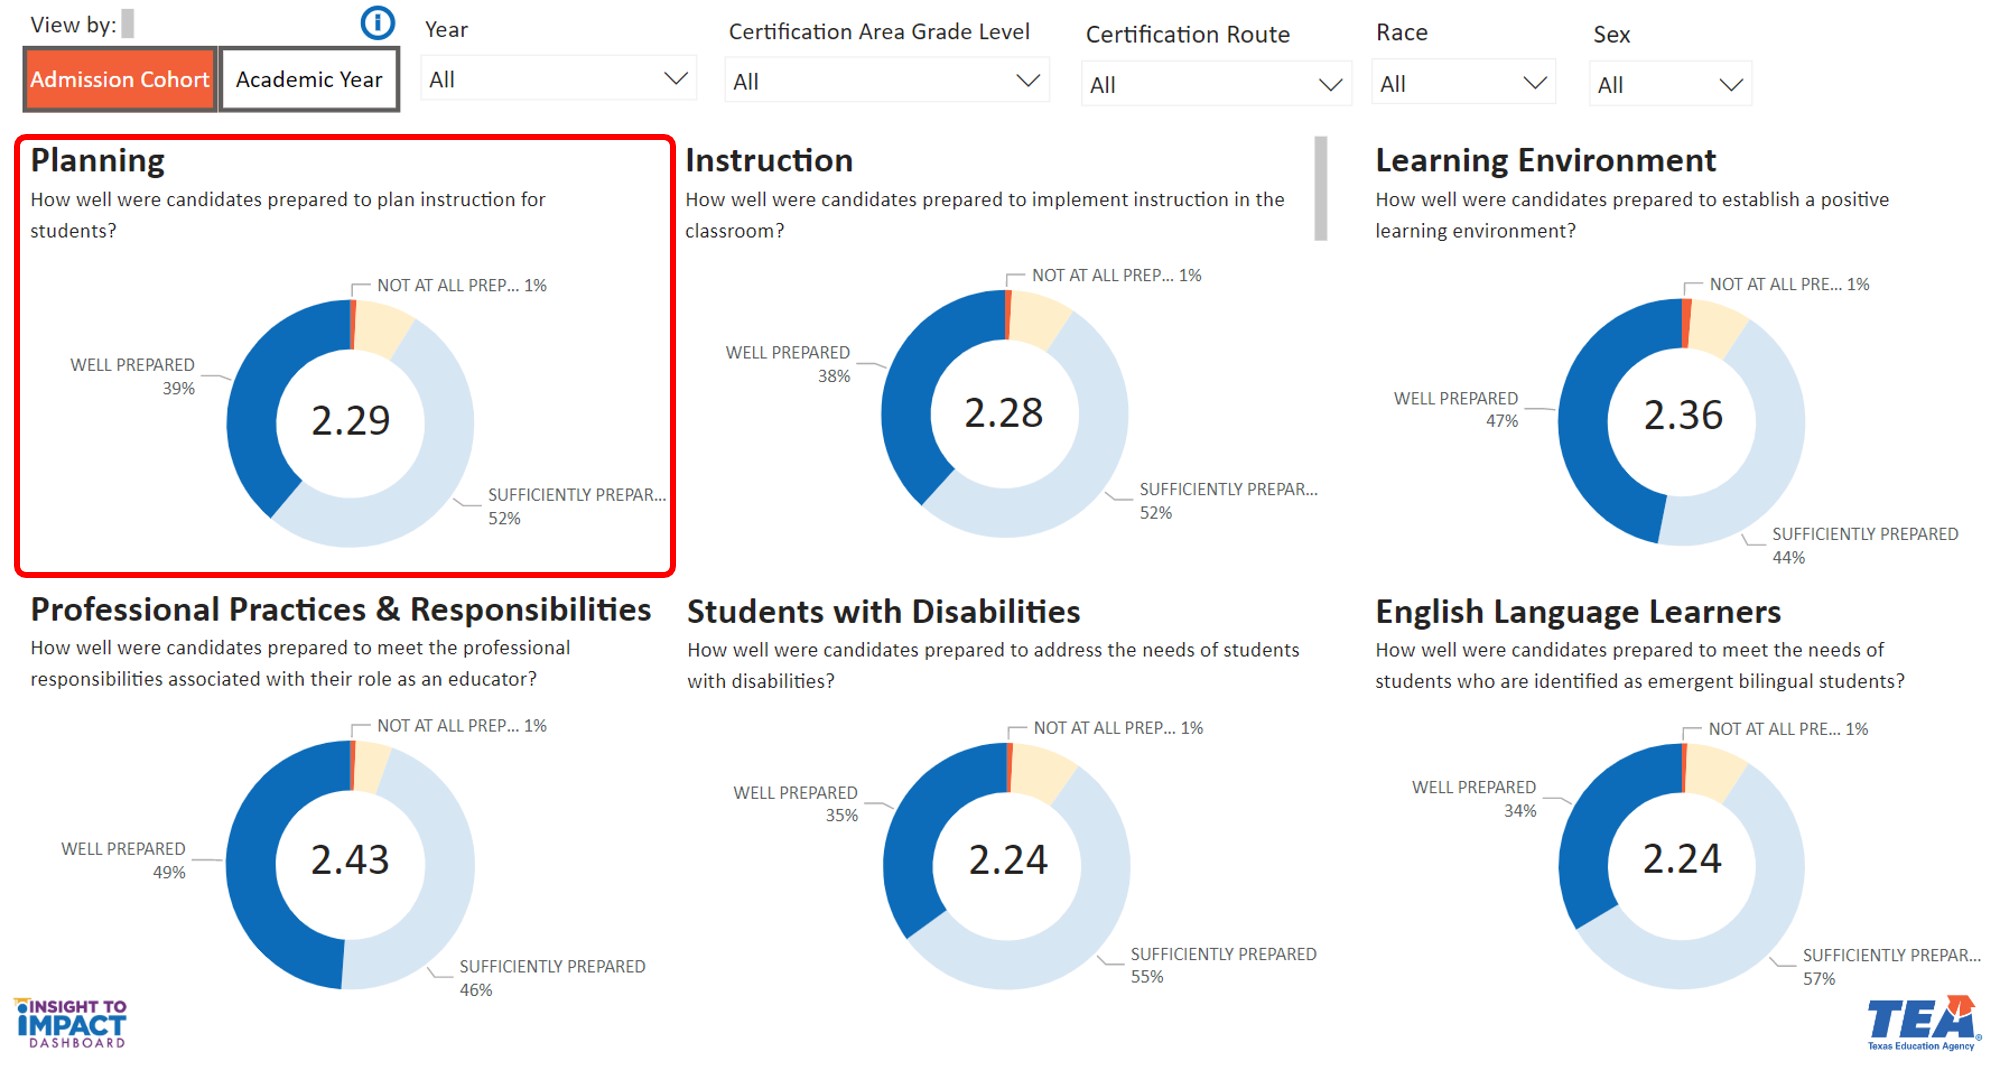
The first visual is titled “Planning” This chart indicates the percentage of principal perceptions on new teacher preparation from your EPP for planning. This view will change based on your selected filters and selection of Admission Cohort or Academic Year. This chart represents survey responses to the following question: How well were candidates prepared to plan instruction for students?
View Principal Perceptions about Instruction
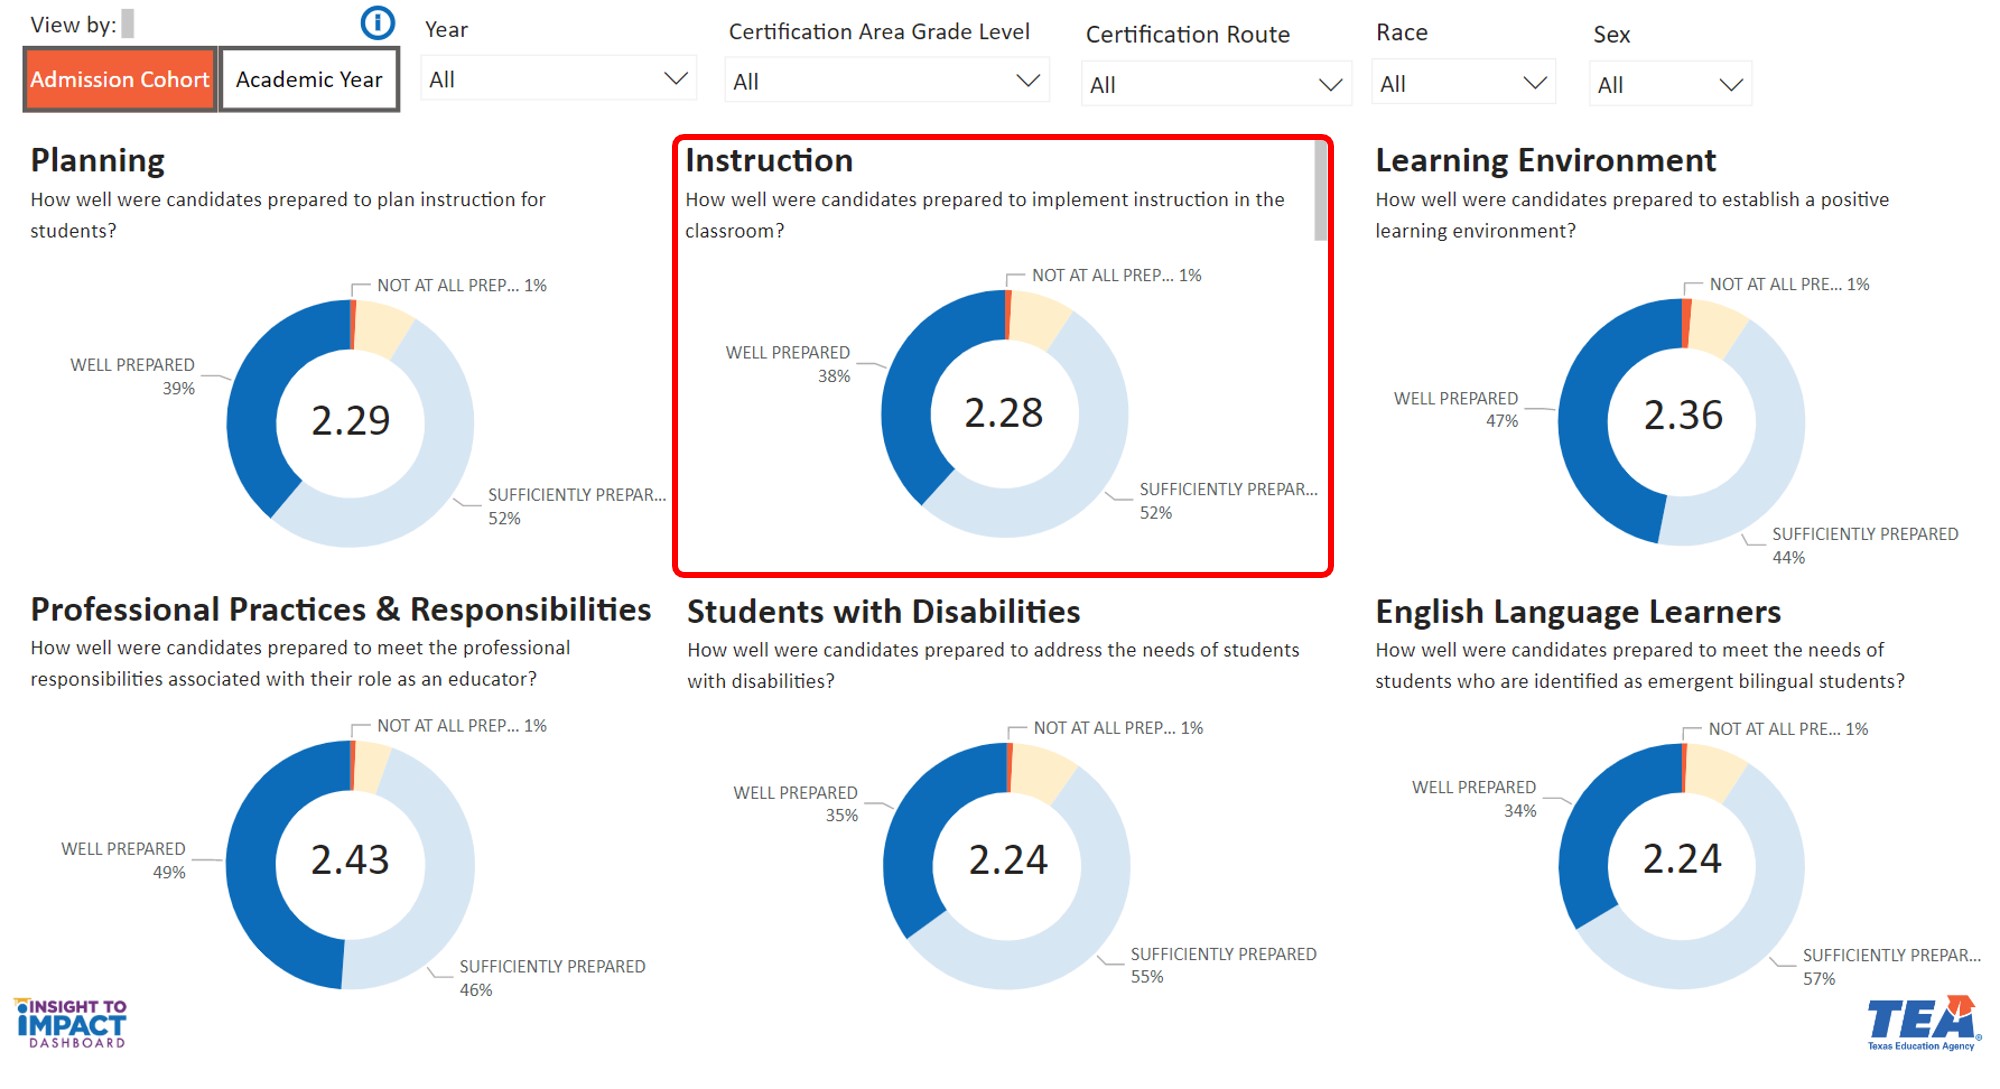
The second visual is titled “Instruction.” This chart indicates the percentage of principal perceptions on new teacher preparation from your EPP for instruction. This view will change based on your selected filters and selection of Admission Cohort or Academic Year. This chart represents survey responses to the following question: How well were candidates prepared to implement instruction in the classroom?
View Principal Perceptions about the Learning Environment
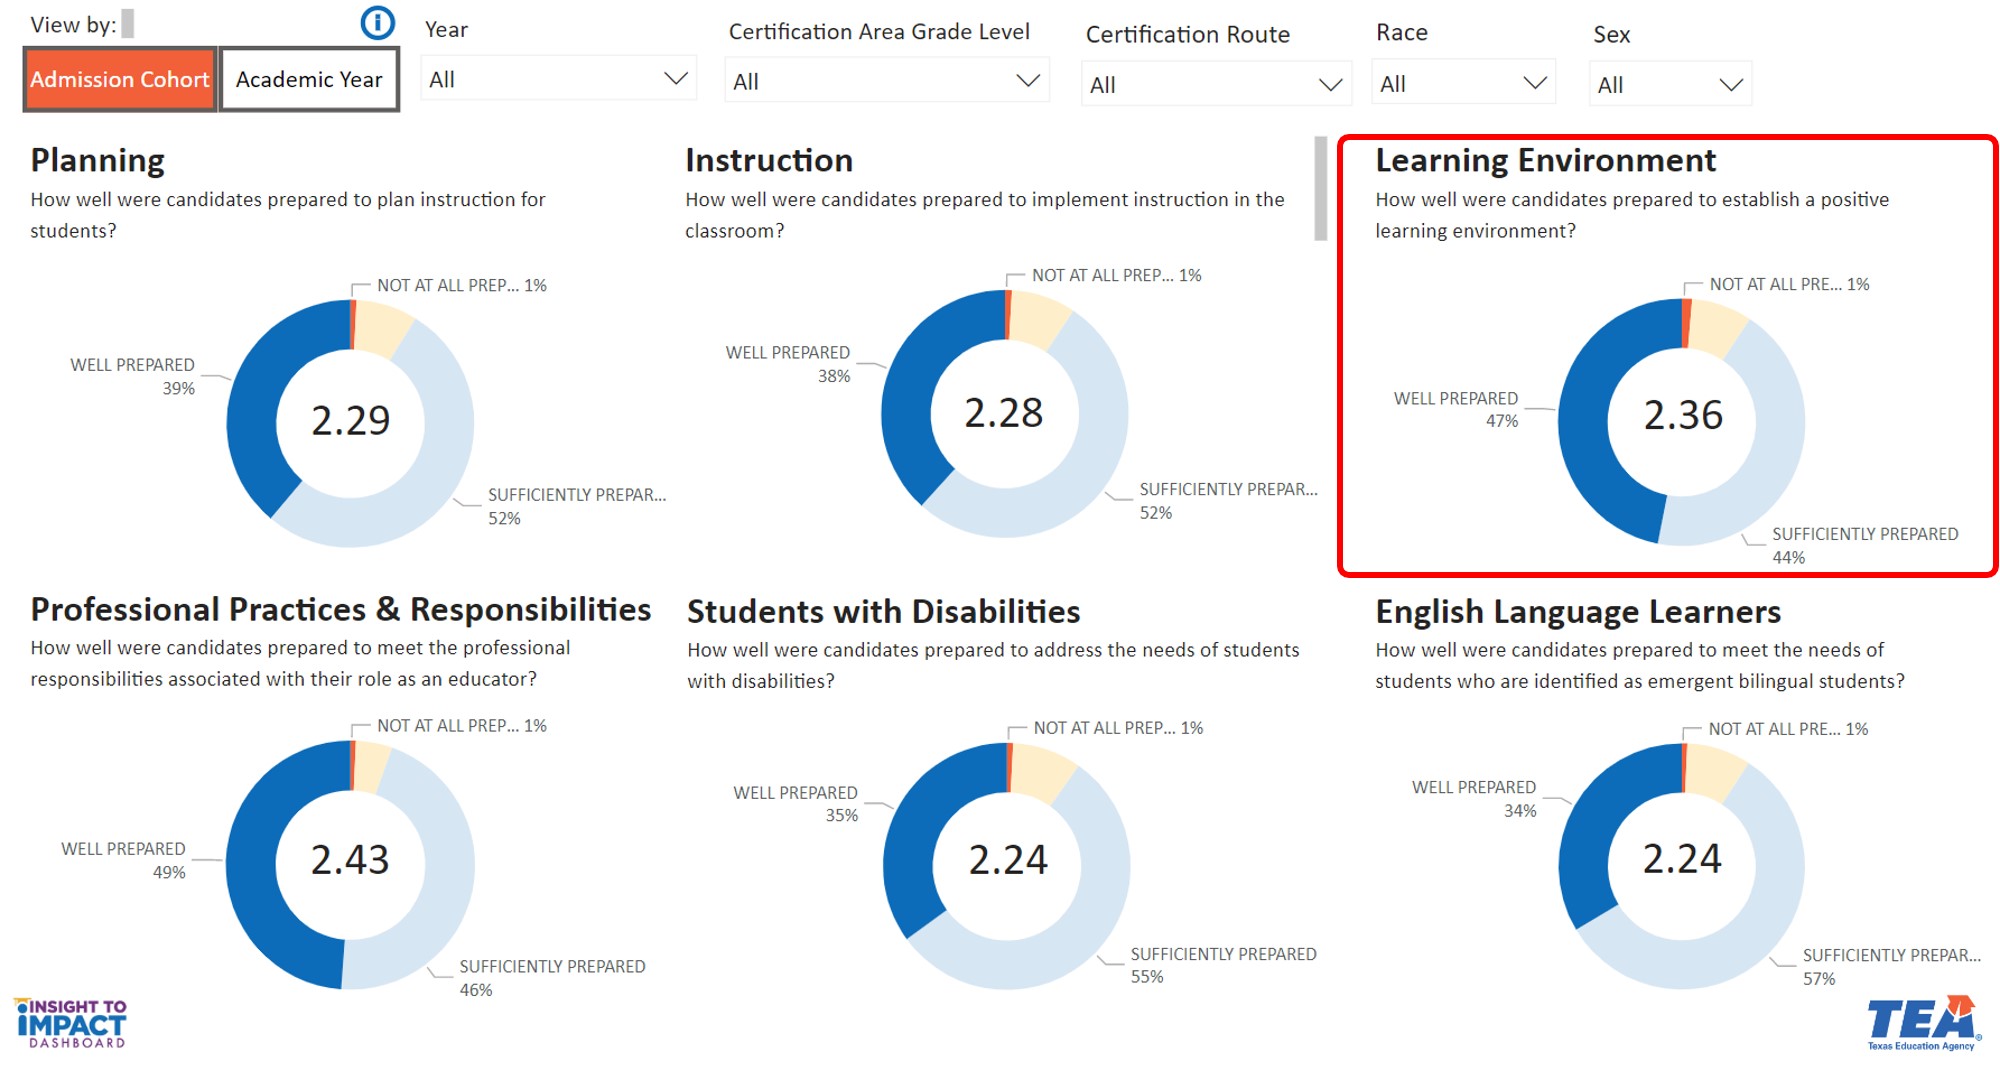
The third visual is titled “Learning Environment.” This chart indicates the percentage of principal perceptions on preparation from your EPP for establishing a positive learning environment. This view will change based on your selected filters and selection of Admission Cohort or Academic Year. This chart represents survey responses to the following question: How well were candidates prepared to establish a positive learning environment?
View Principal Perceptions about Professional Practices & Responsibilities
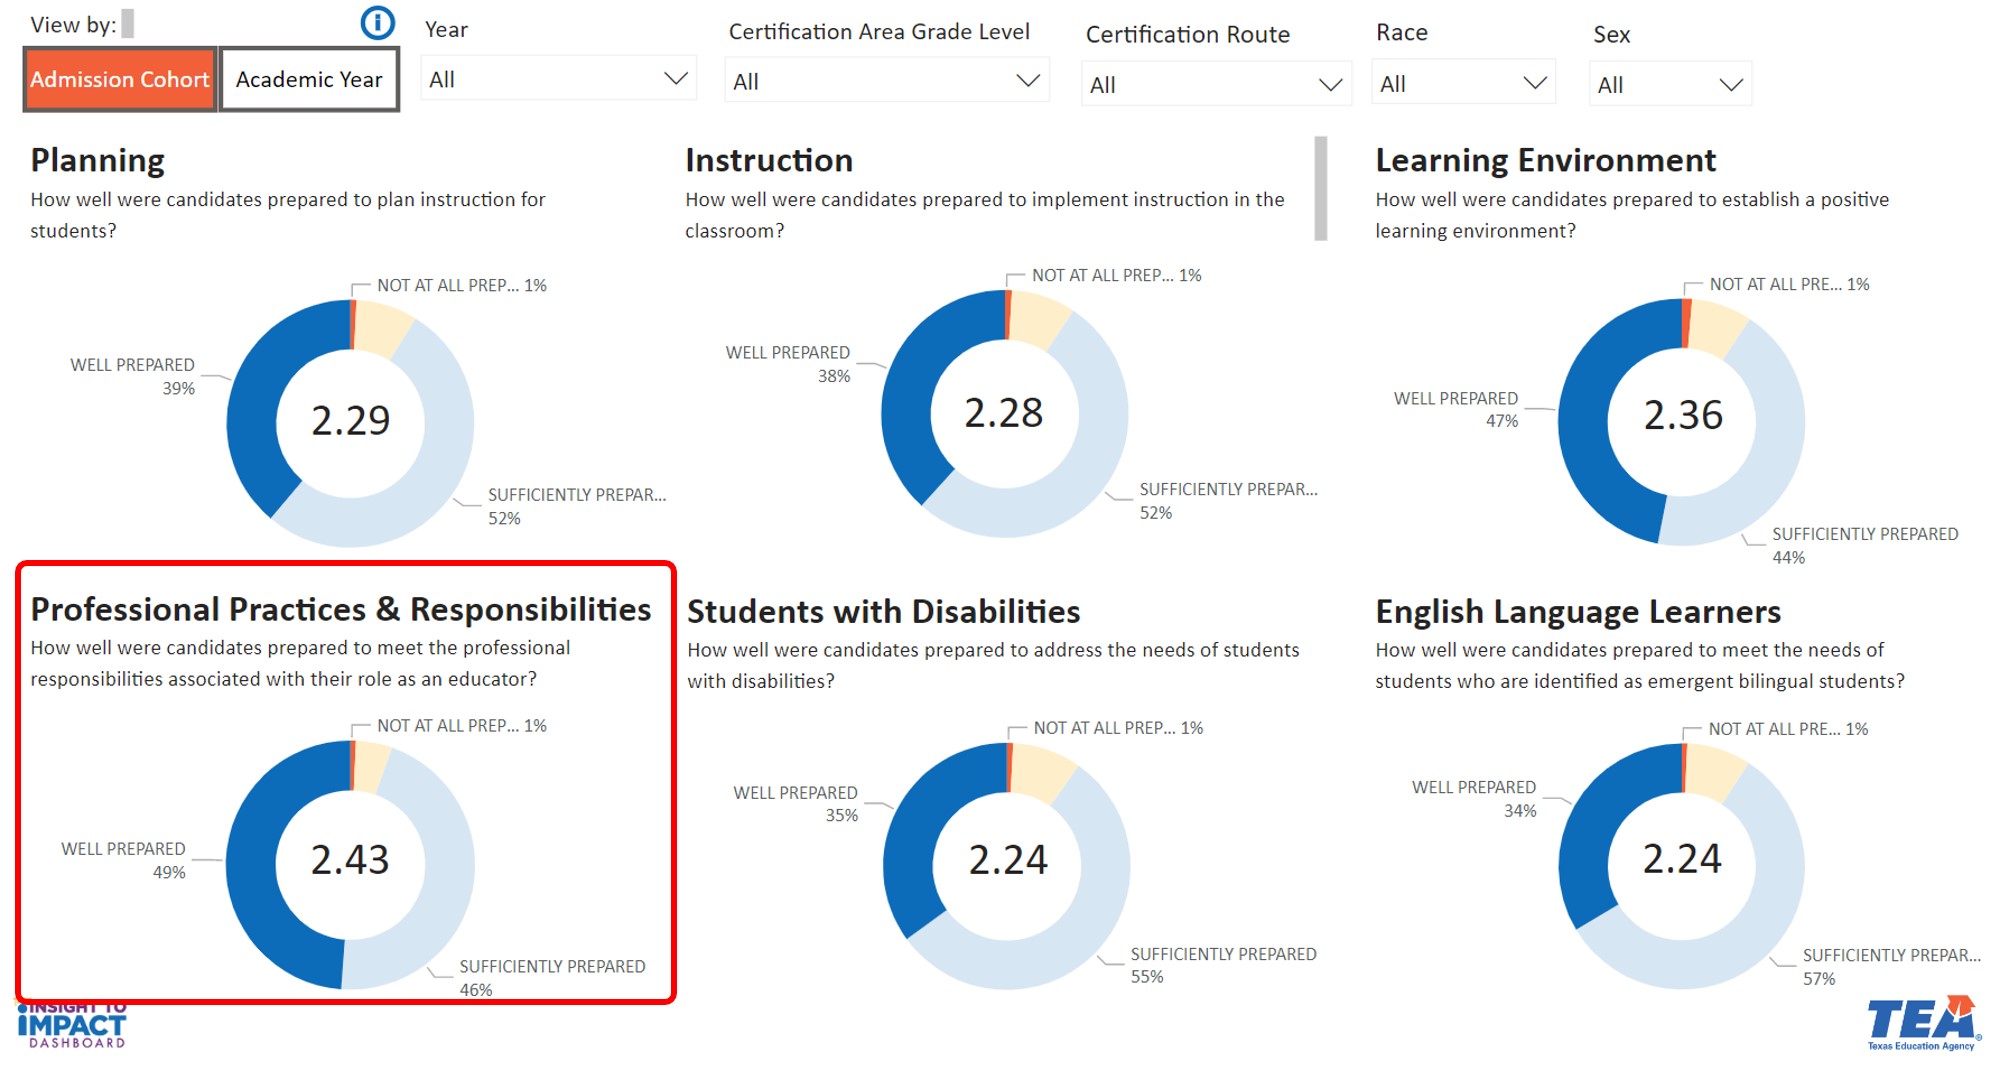
The fourth visual is titled “Professional Practices & Responsibilities.” This chart indicates the percentage of principal perceptions on preparation of new teachers from your EPP to meet professional responsibilities in their role as an educator. This view will change based on your selected filters and selection of Admission Cohort or Academic Year. This chart represents survey responses to the following question: How well were candidates prepared to meet the professional responsibilities associated with their role as an educator?
View Principal Perceptions about Students with Disabilities
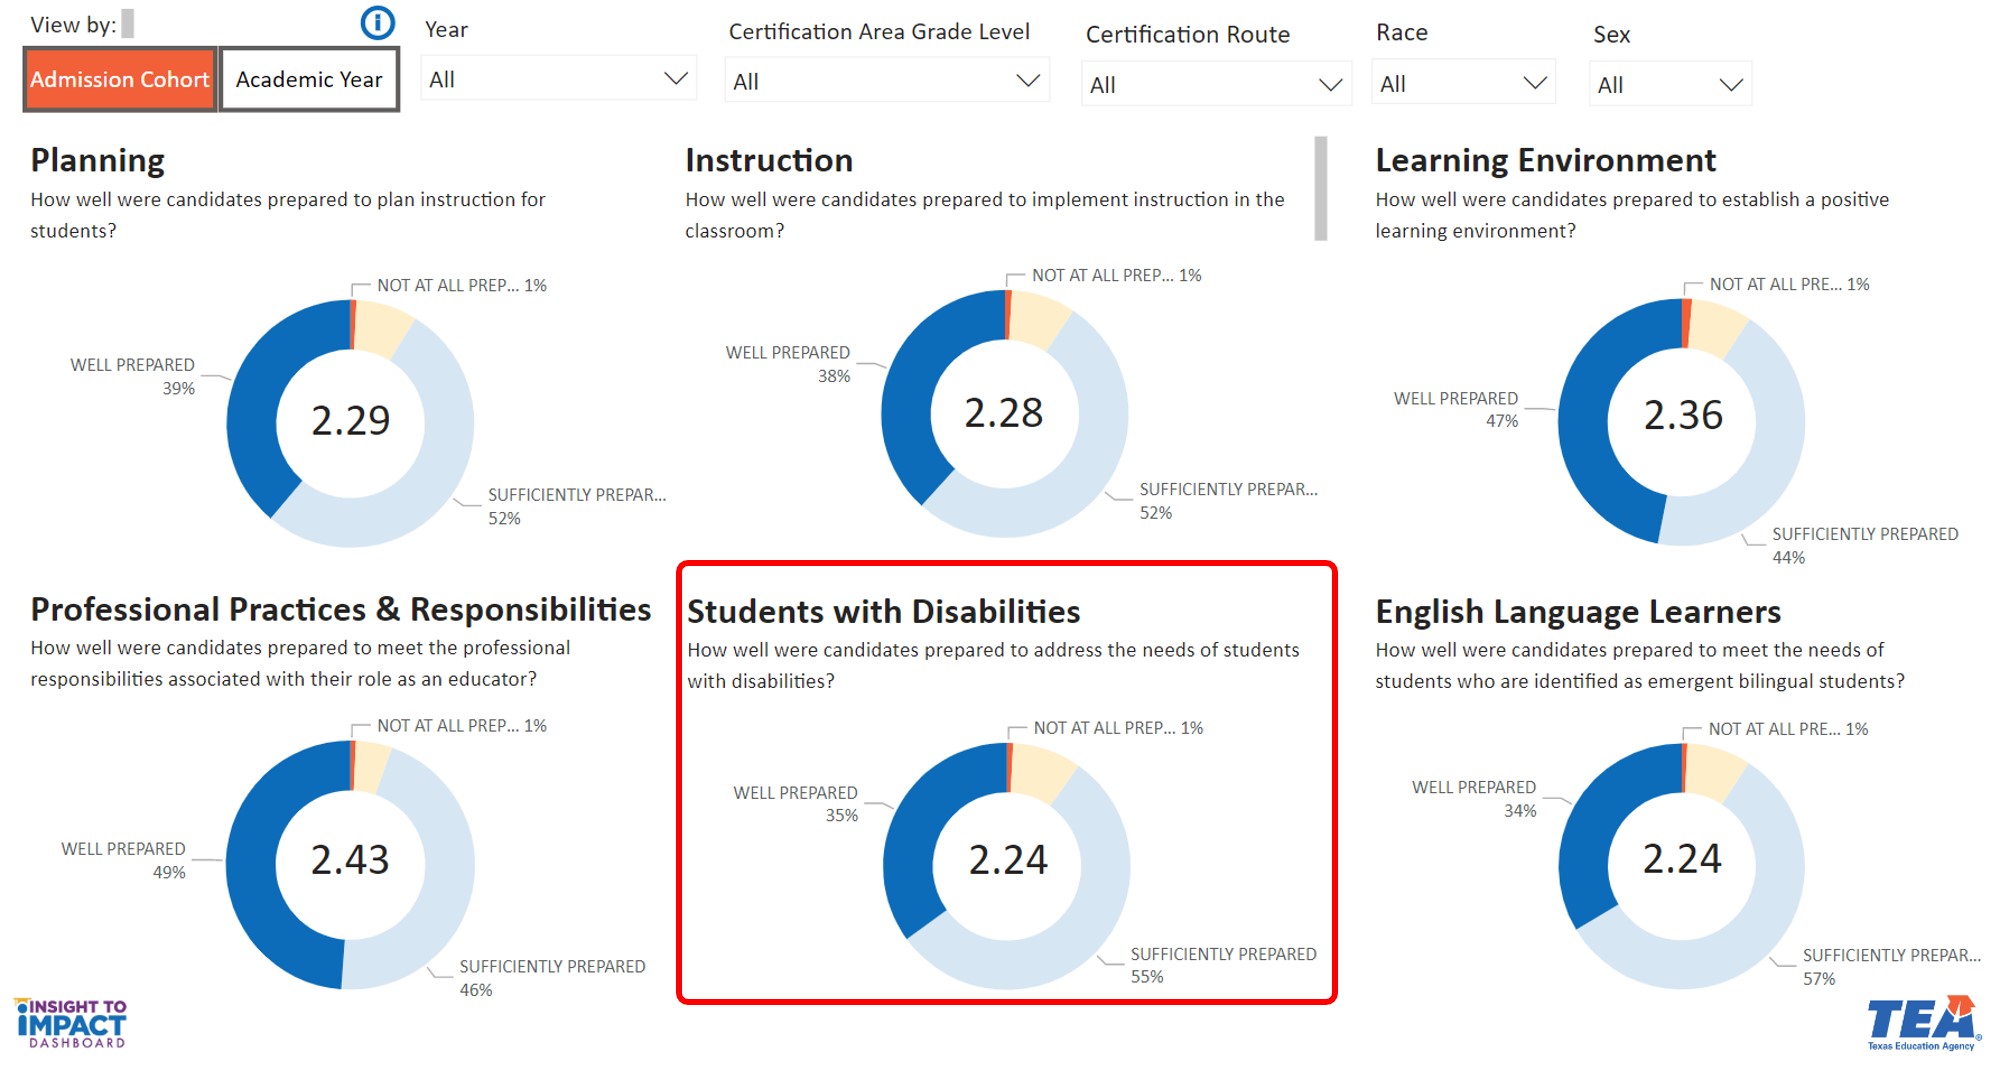
The fifth visual is titled “Students with Disabilities.” This chart indicates the percentage of principal perceptions on preparation of new teachers from your EPP for addressing the needs of students with disabilities. This view will change based on your selected filters and selection of Admission Cohort or Academic Year. This chart represents survey responses to the following question: How well were candidates prepared to address the needs of students with disabilities?
View Principal Perceptions about English Language Learners
The sixth visual is titled “English Language Learners.” This chart indicates the percentage of principal perceptions on preparation of new teachers from your EPP for meeting the needs of students identified as emergent bilingual. This view will change based on your selected filters and selection of Admission Cohort or Academic Year. This chart represents survey responses to the following question: How well were candidates prepared to meet the needs of students who identified as emergent bilingual students?

