Candidate Summary
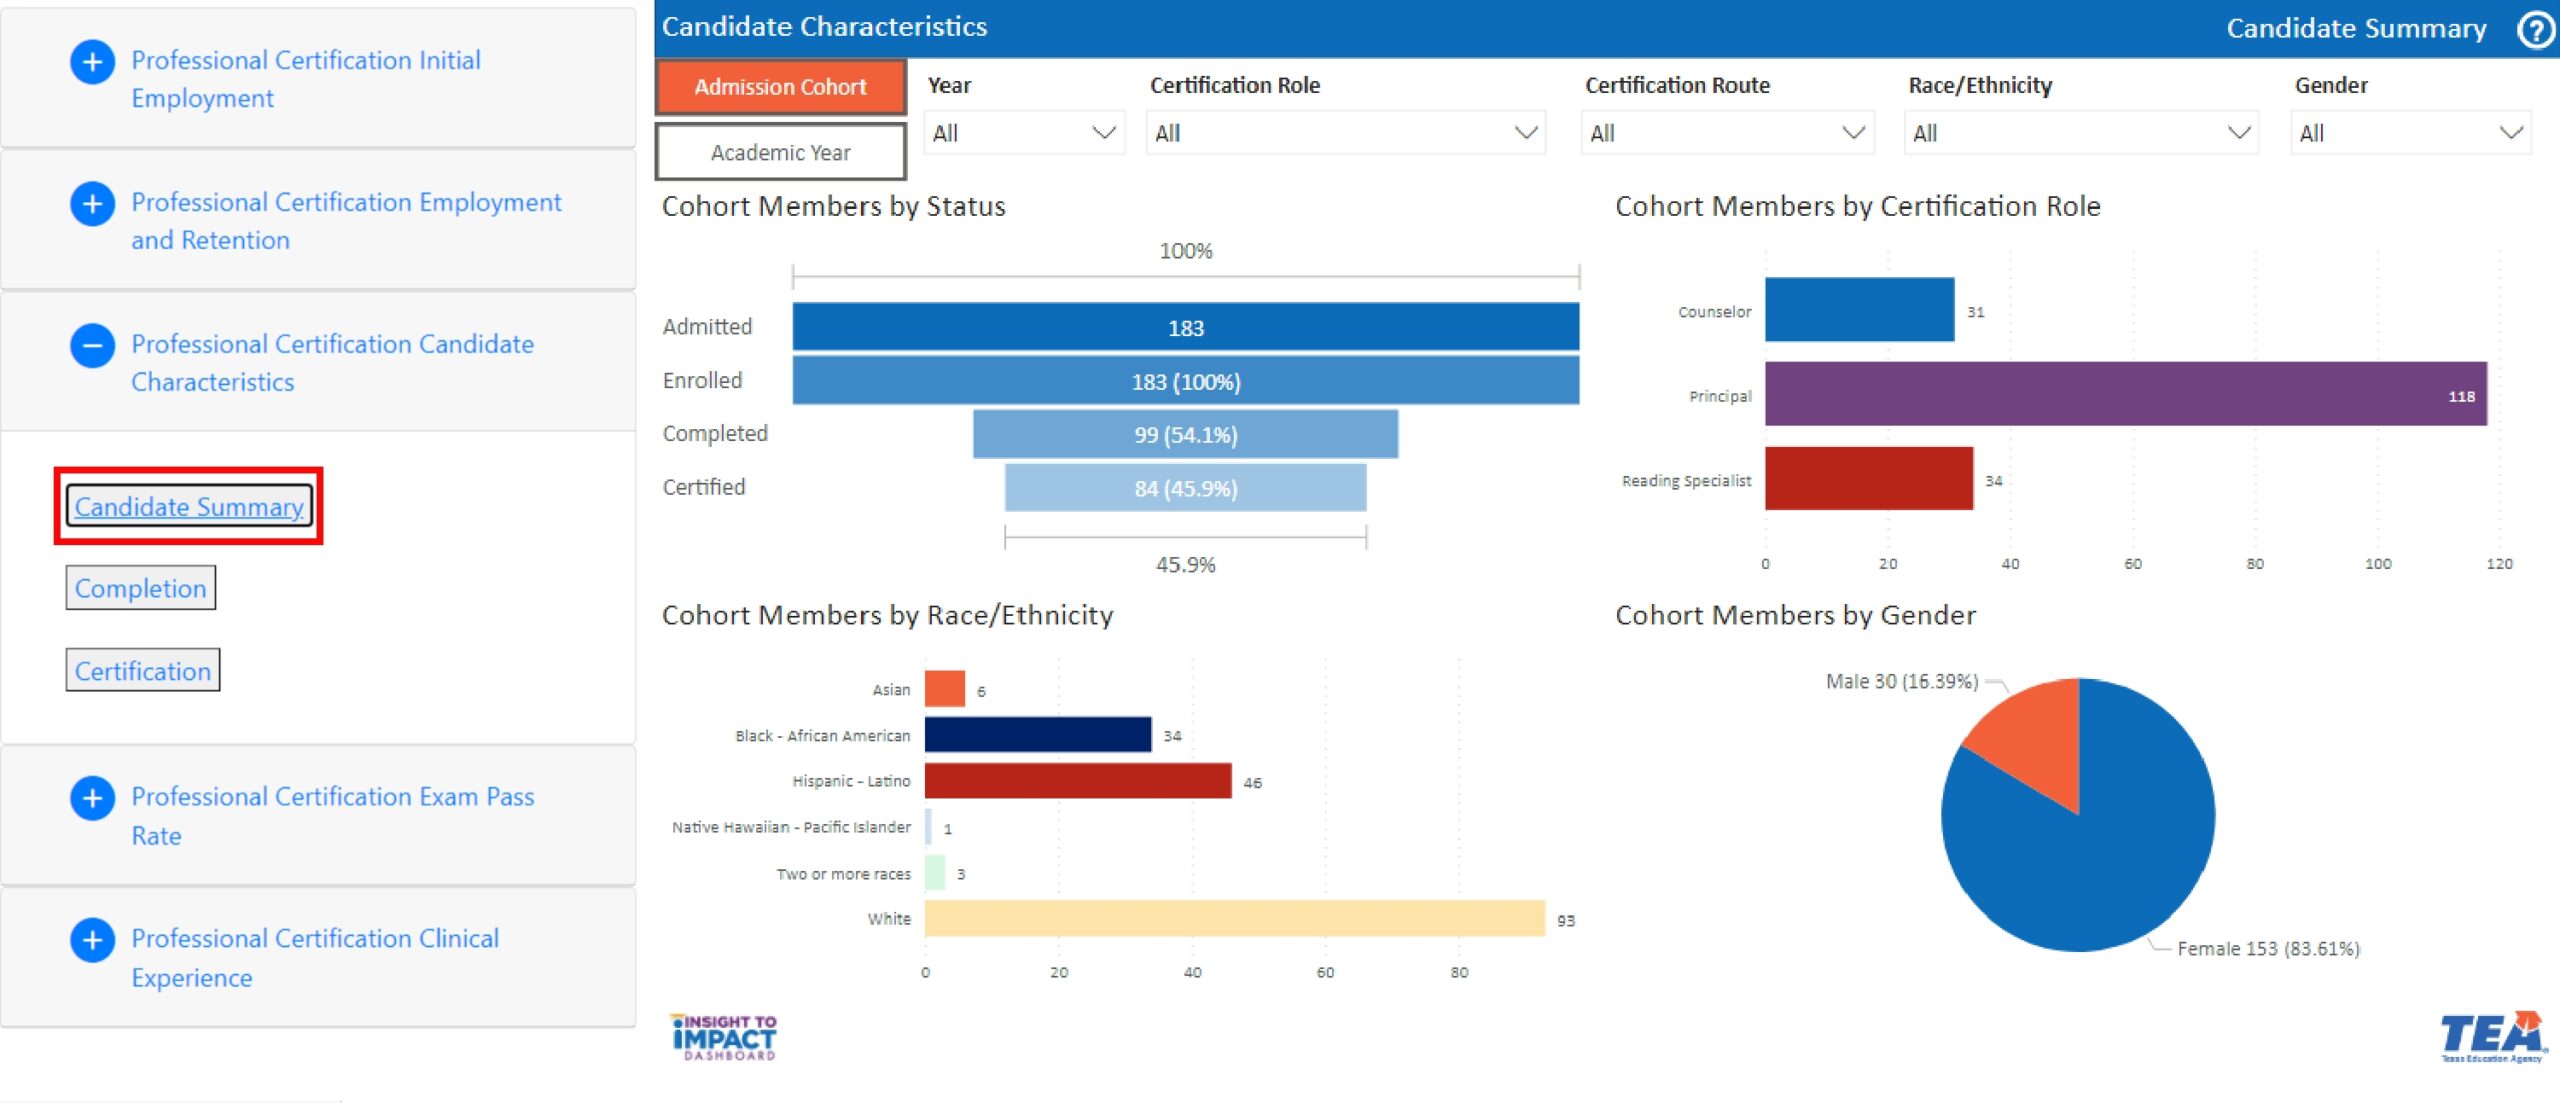
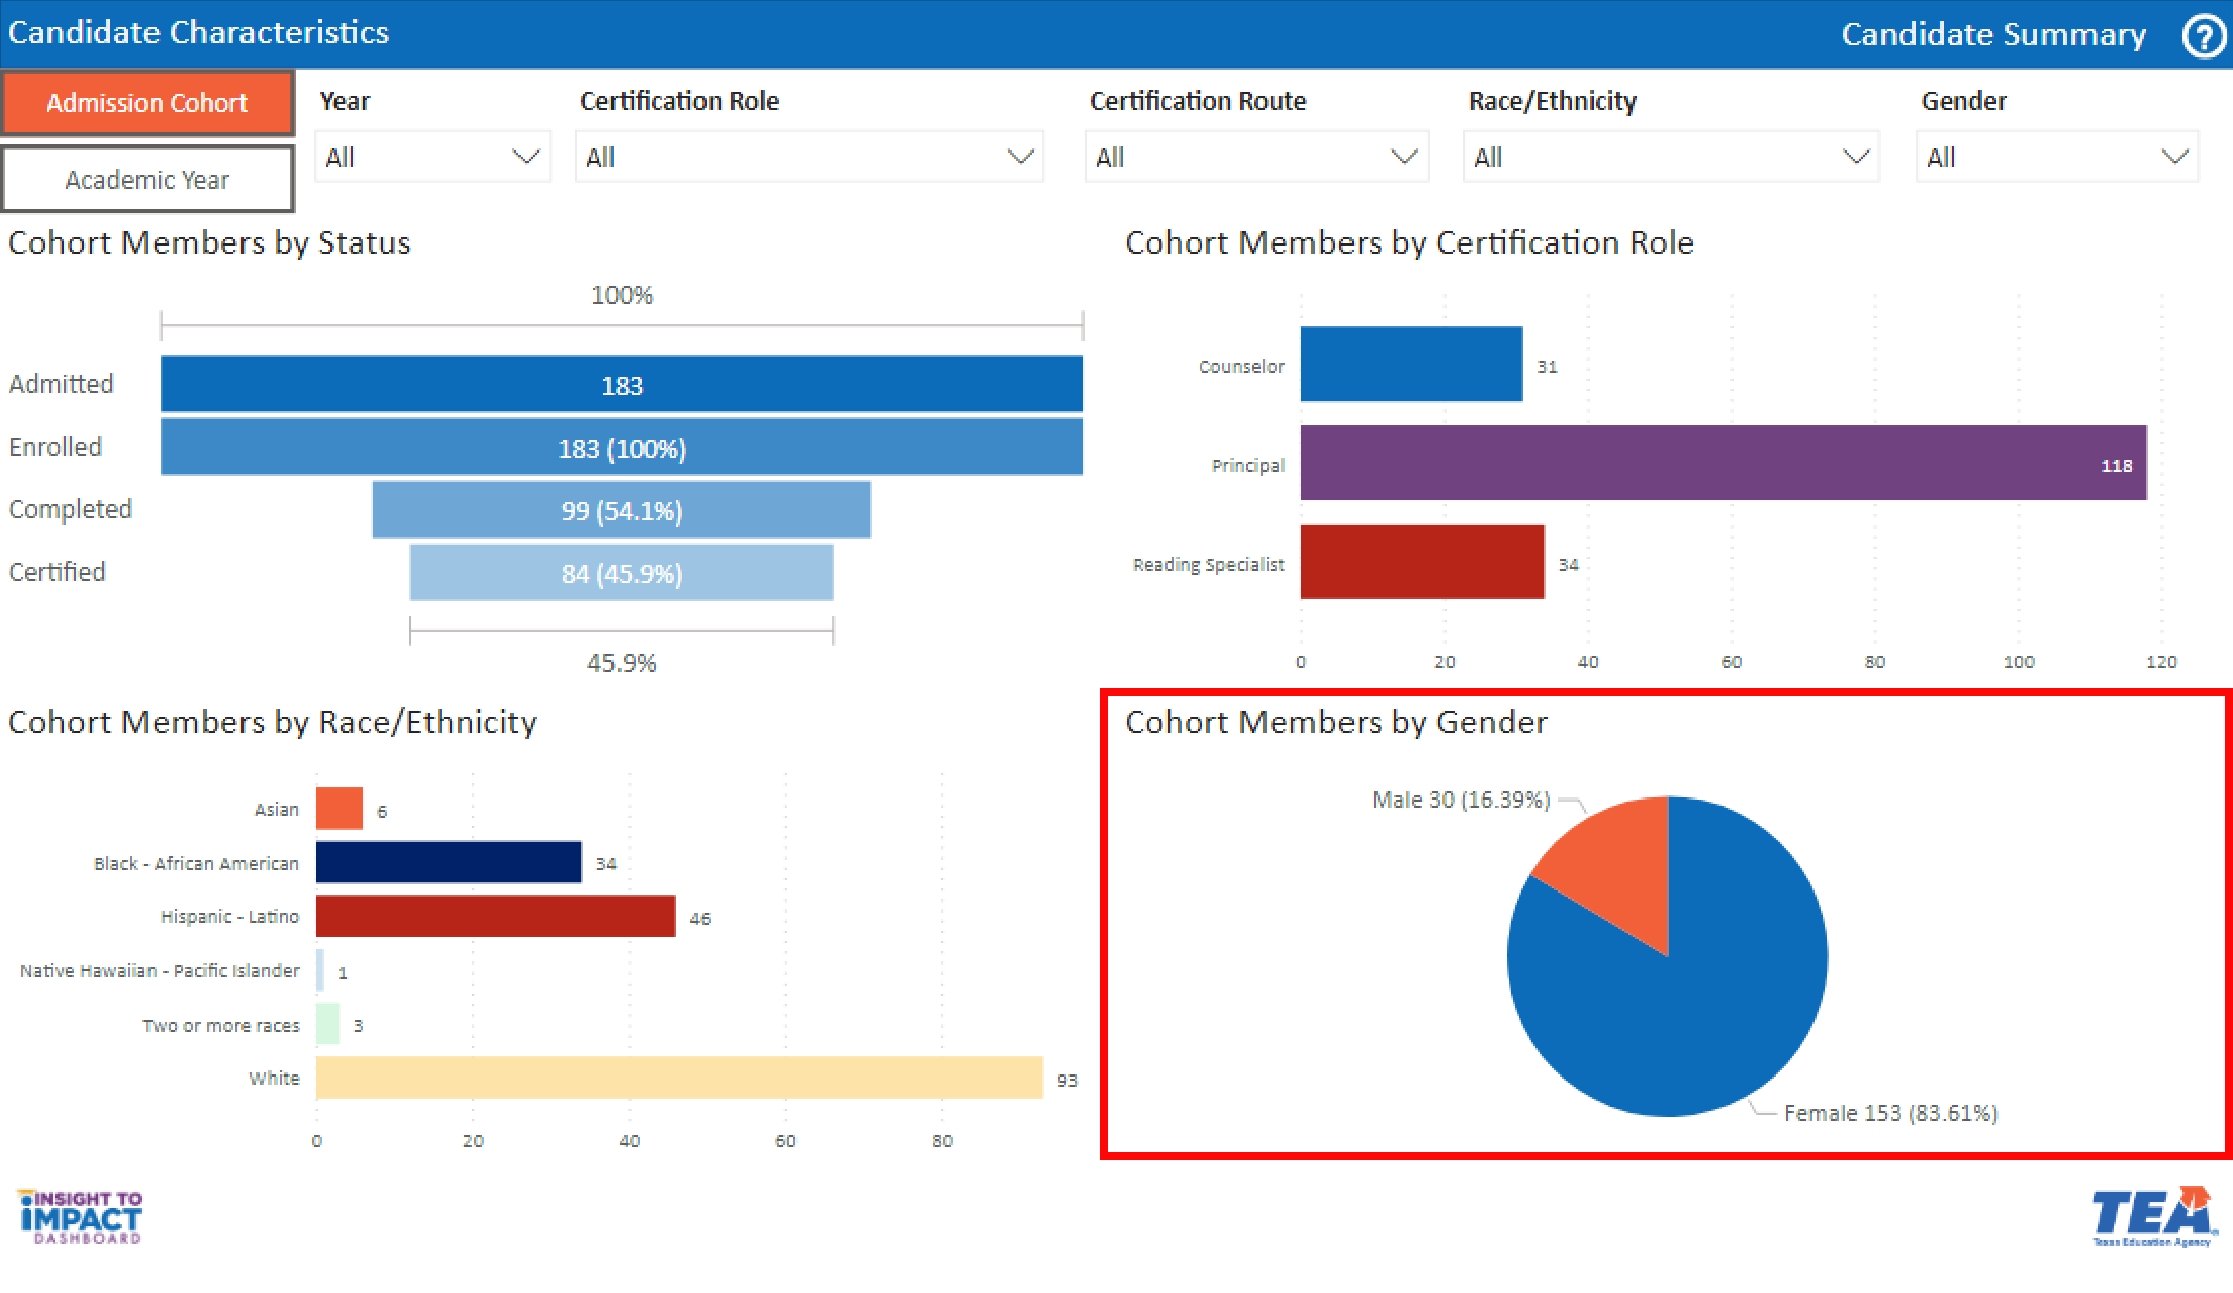
The Candidate Summary page details counts of candidates in an admission cohort or academic year for your EPP by status: admitted, enrolled, completed, and certified. It also provides counts by program, race/ethnicity, and gender.
Navigate to the Candidate Summary
Select the “Candidate Summary” page from the menu. On this page, you will be able to filter information by Year, Certification Role, Certification Route, Race/Ethnicity, and Gender.
Select Admission Cohort or Academic Year
- Use the Academic Cohort button to view candidate characteristics for candidates in the same cohort.
- Use the Academic Year button to view candidate characteristics for all candidates in a specific academic year, regardless of cohort.
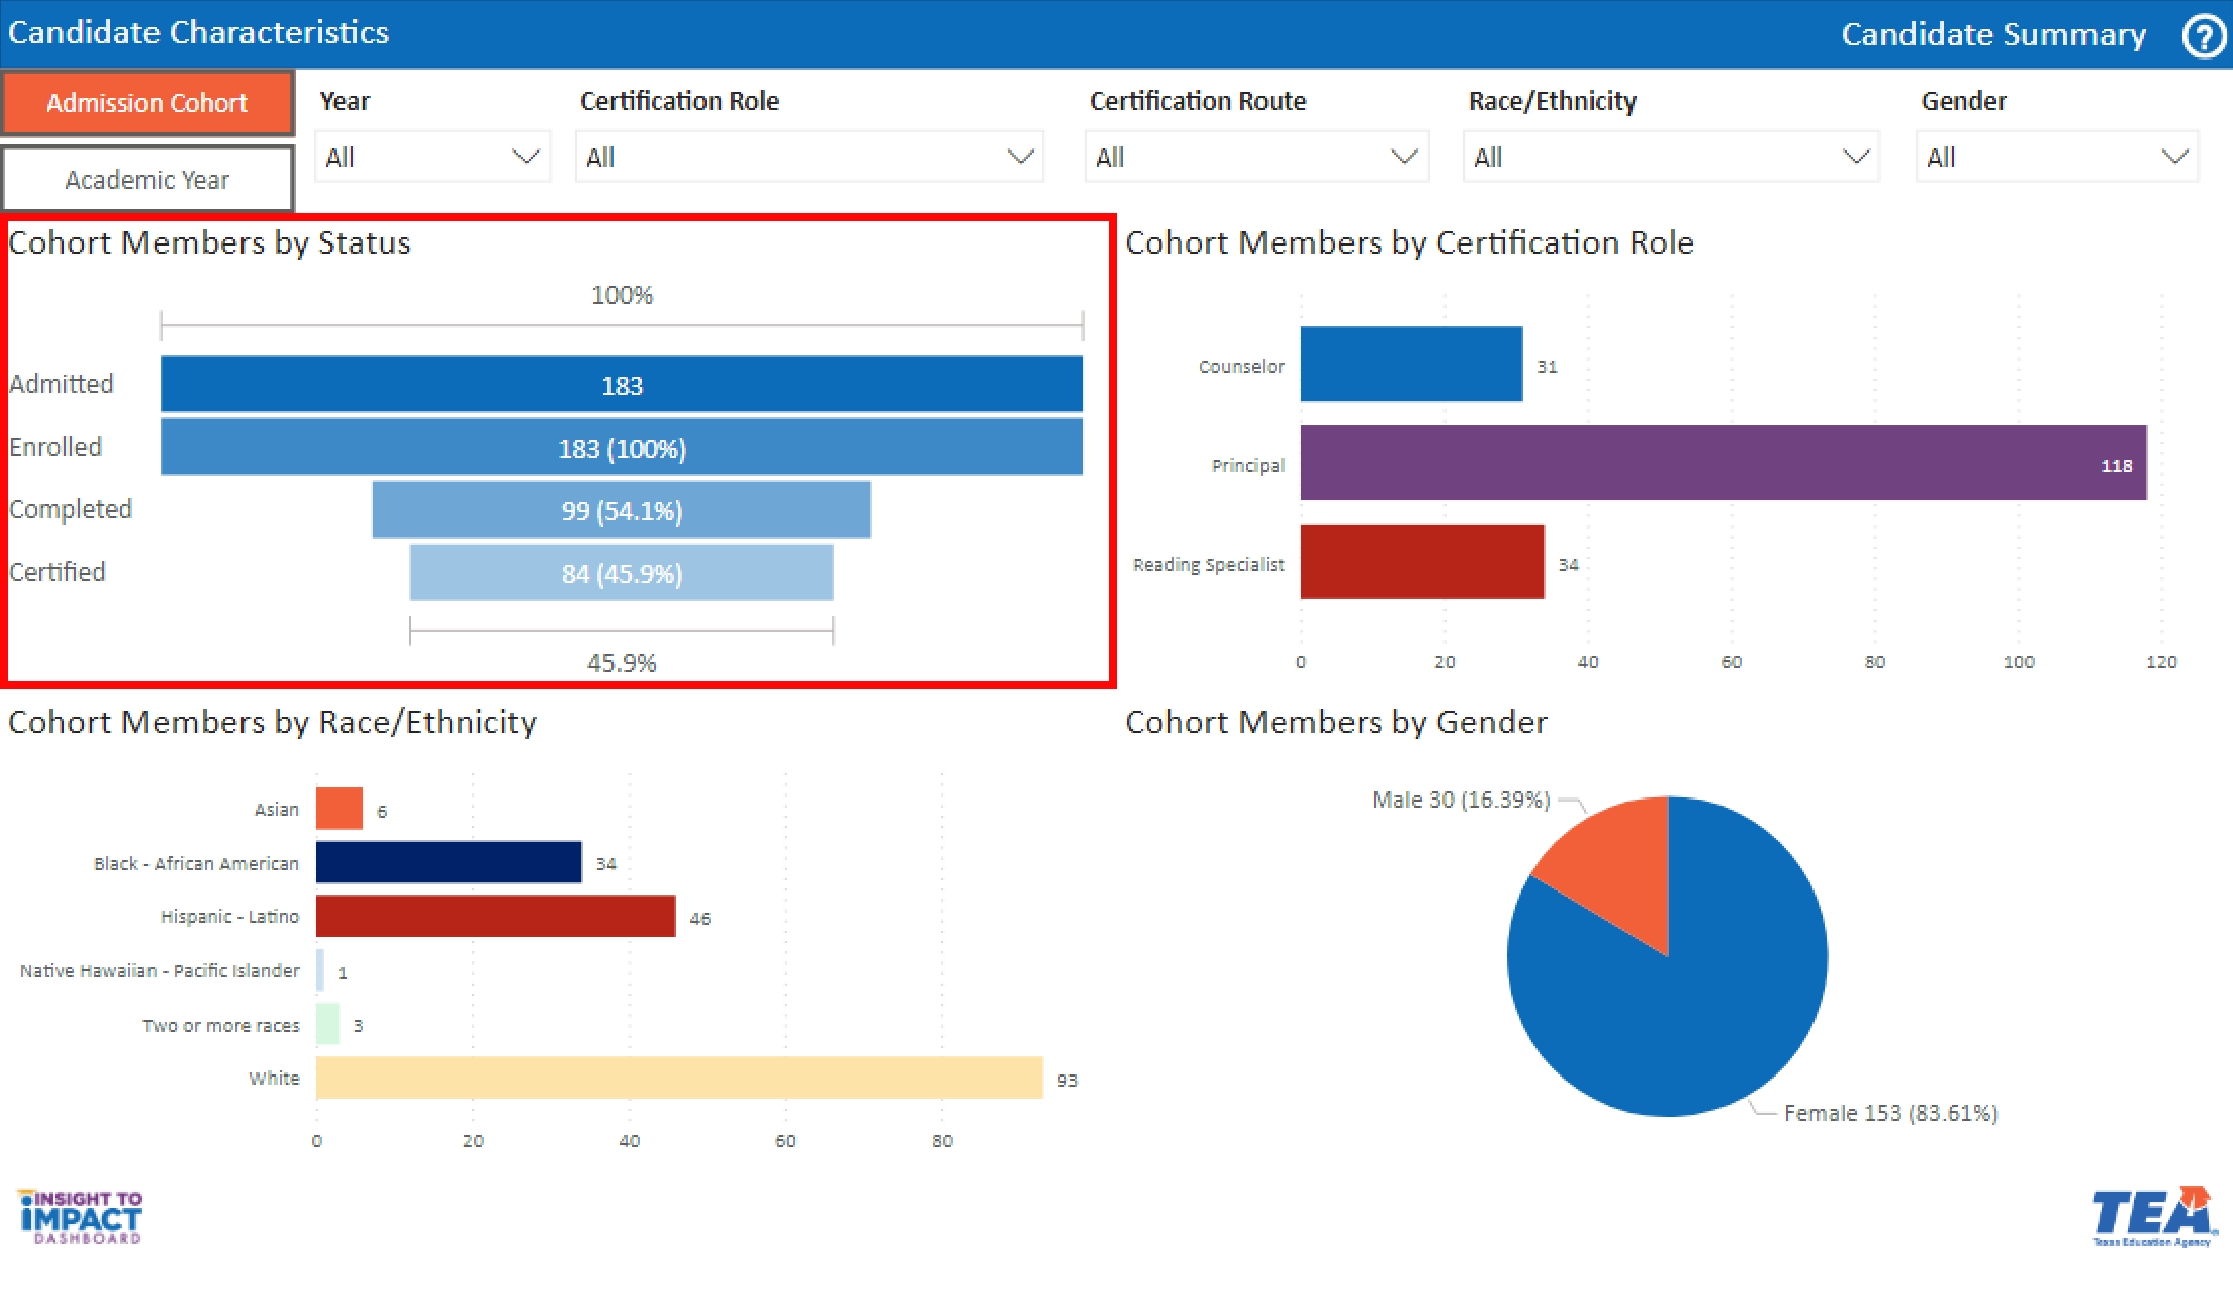
View the Count of Candidates by Status
- The first visual is titled, “Cohort Members by Status.” This bar graph indicates the count of candidates by status for your EPP. This view will change based on your selected filters and Academic Cohort or Academic Year selection.
- Hover over the individual sections of the bar graph to view percentages.
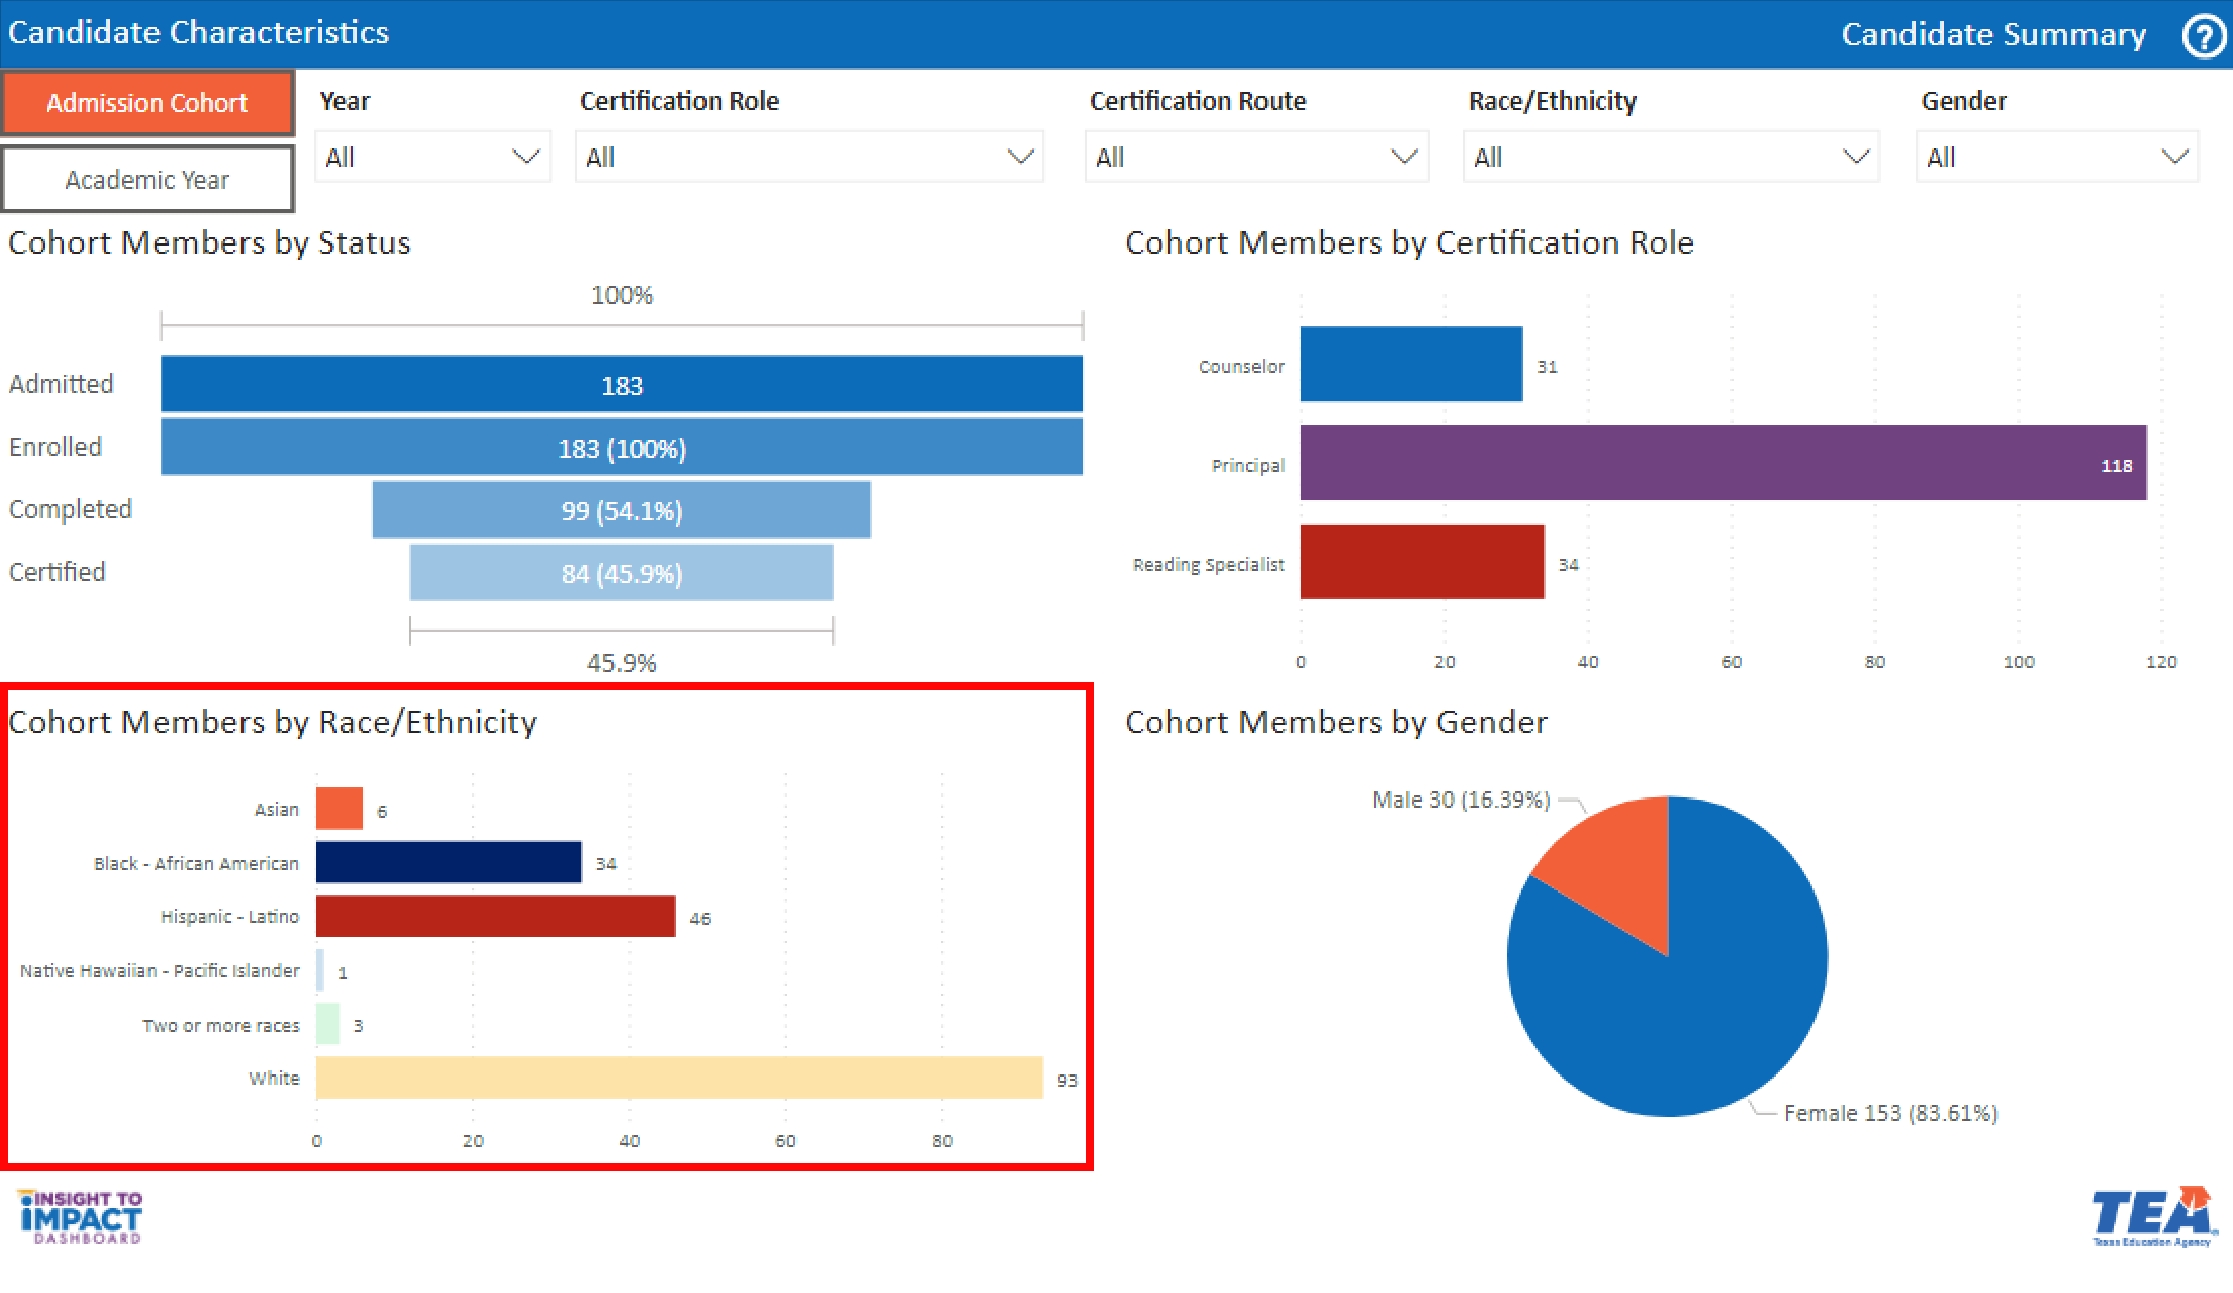
View the Count of Candidates by Race/Ethnicity
The second visual is titled, “Cohort Members by Race/Ethnicity.” This bar graph indicates the count of candidates by race/ethnicity in your EPP. This view will change based on your selected filters and Academic Cohort or Academic Year selection.
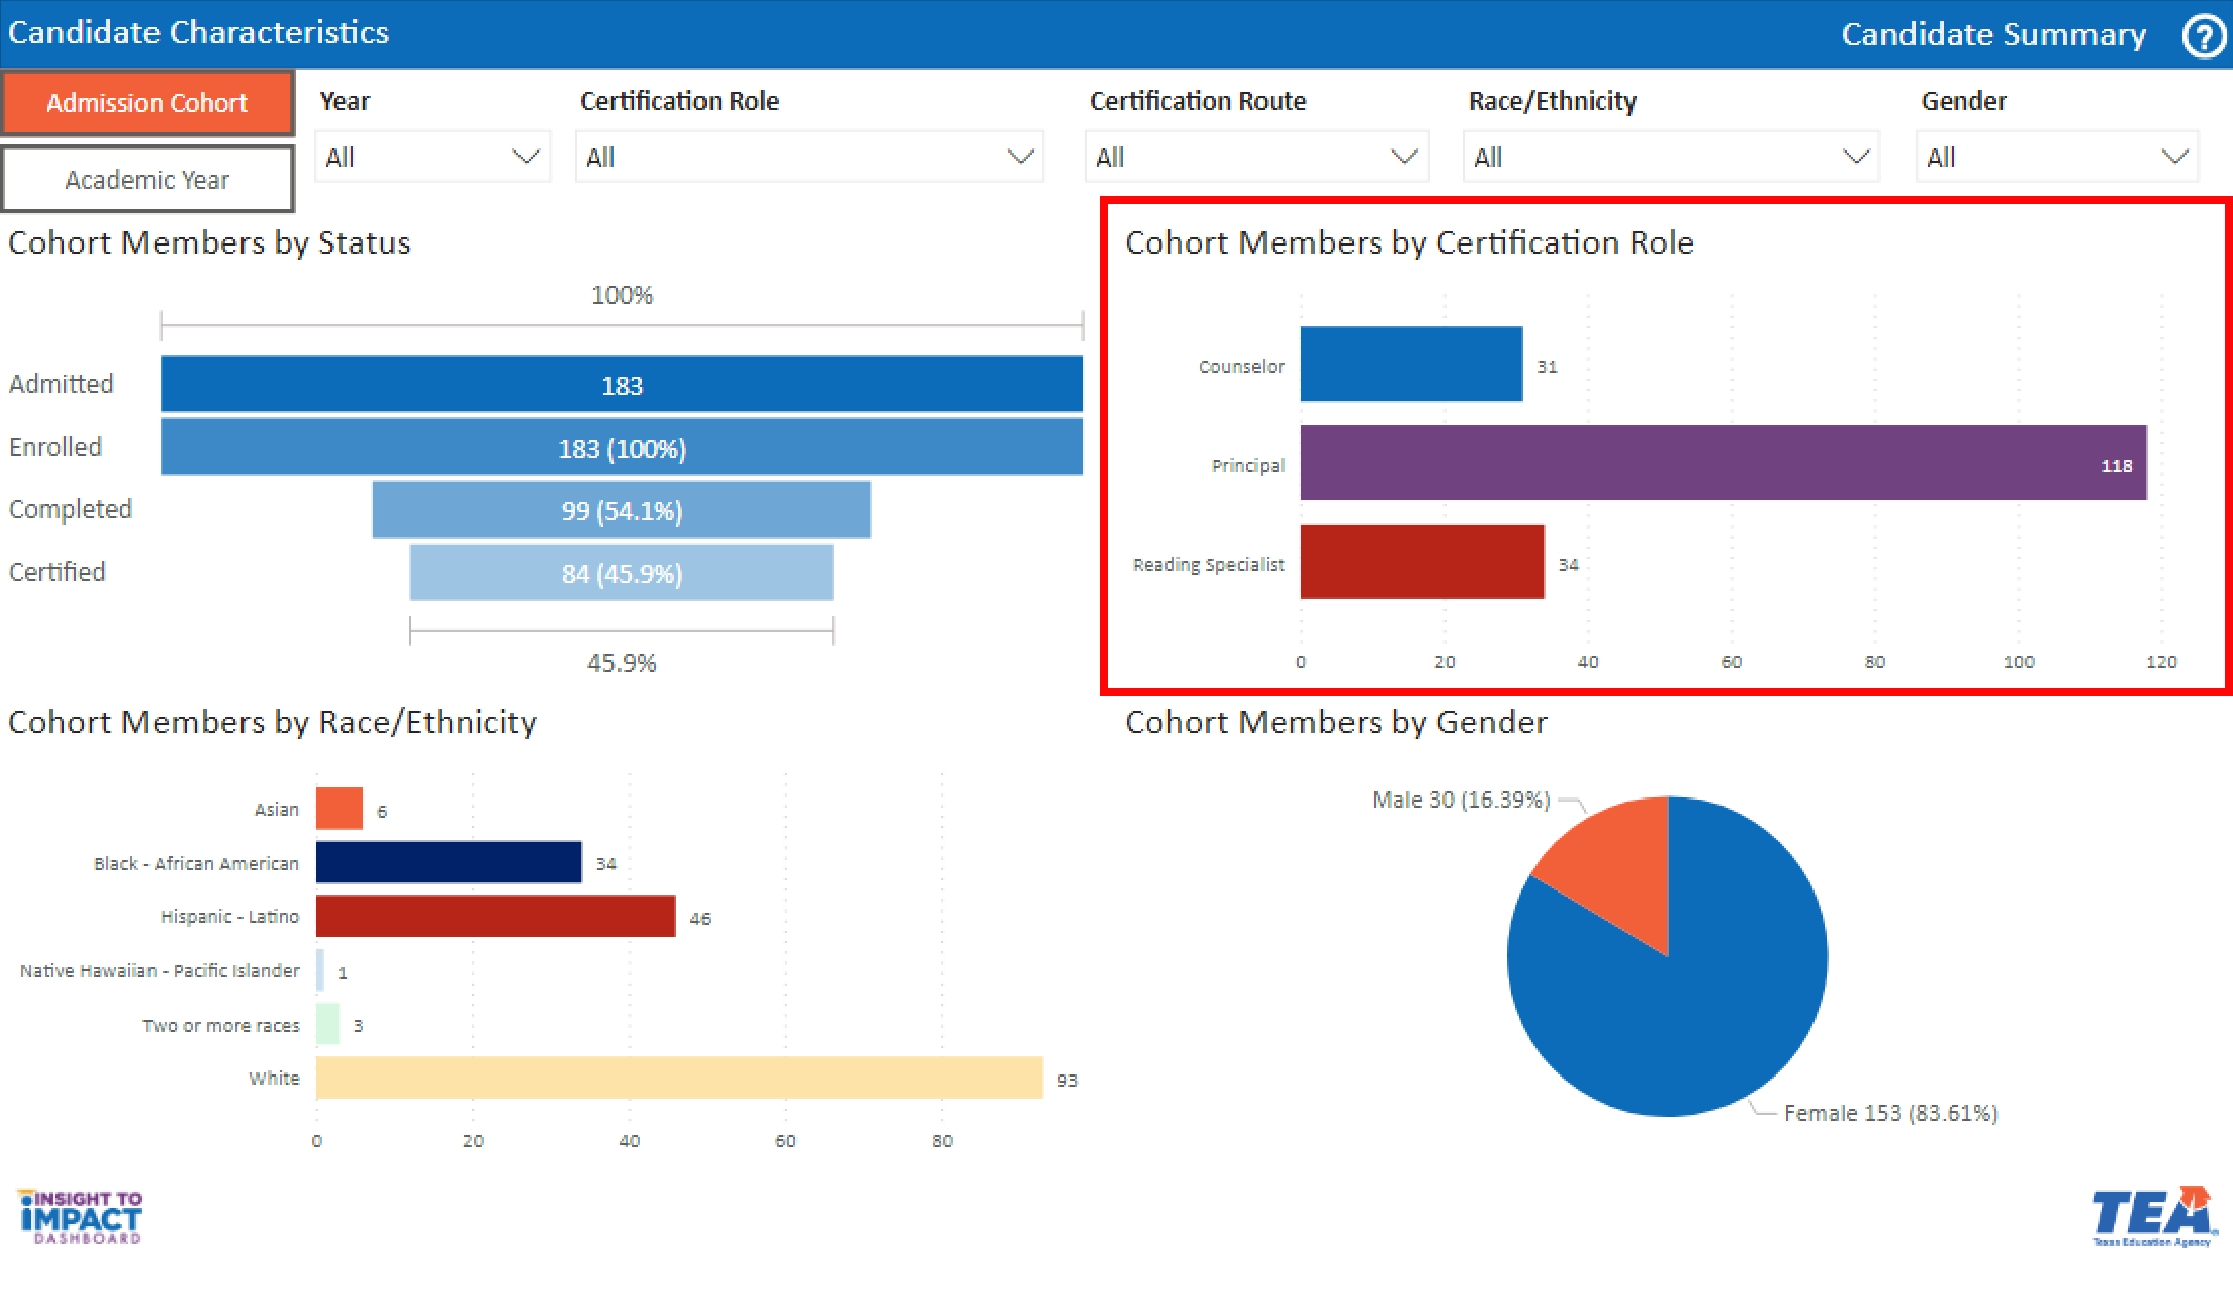
View the Count of Cohort Members by Certification Role
The third visual is titled, “Cohort Members by Certification Role.” This bar graph indicates the count of cohort members by certification role in your EPP. This view will change based on your selected filters and Academic Cohort or Academic Year selection.
View the Count of Cohort Members by Gender
The fourth visual is titled, “Cohort Members by Gender.” This pie chart indicates the count and percentage of cohort members by gender in your EPP. This view will change based on your selected filters and Academic Cohort or Academic Year selection.

