Pass Rate Summary Table
The Pass Rate Summary Table page provides your EPP with candidate specific information about candidate demographics, certification area, and exam attempts.
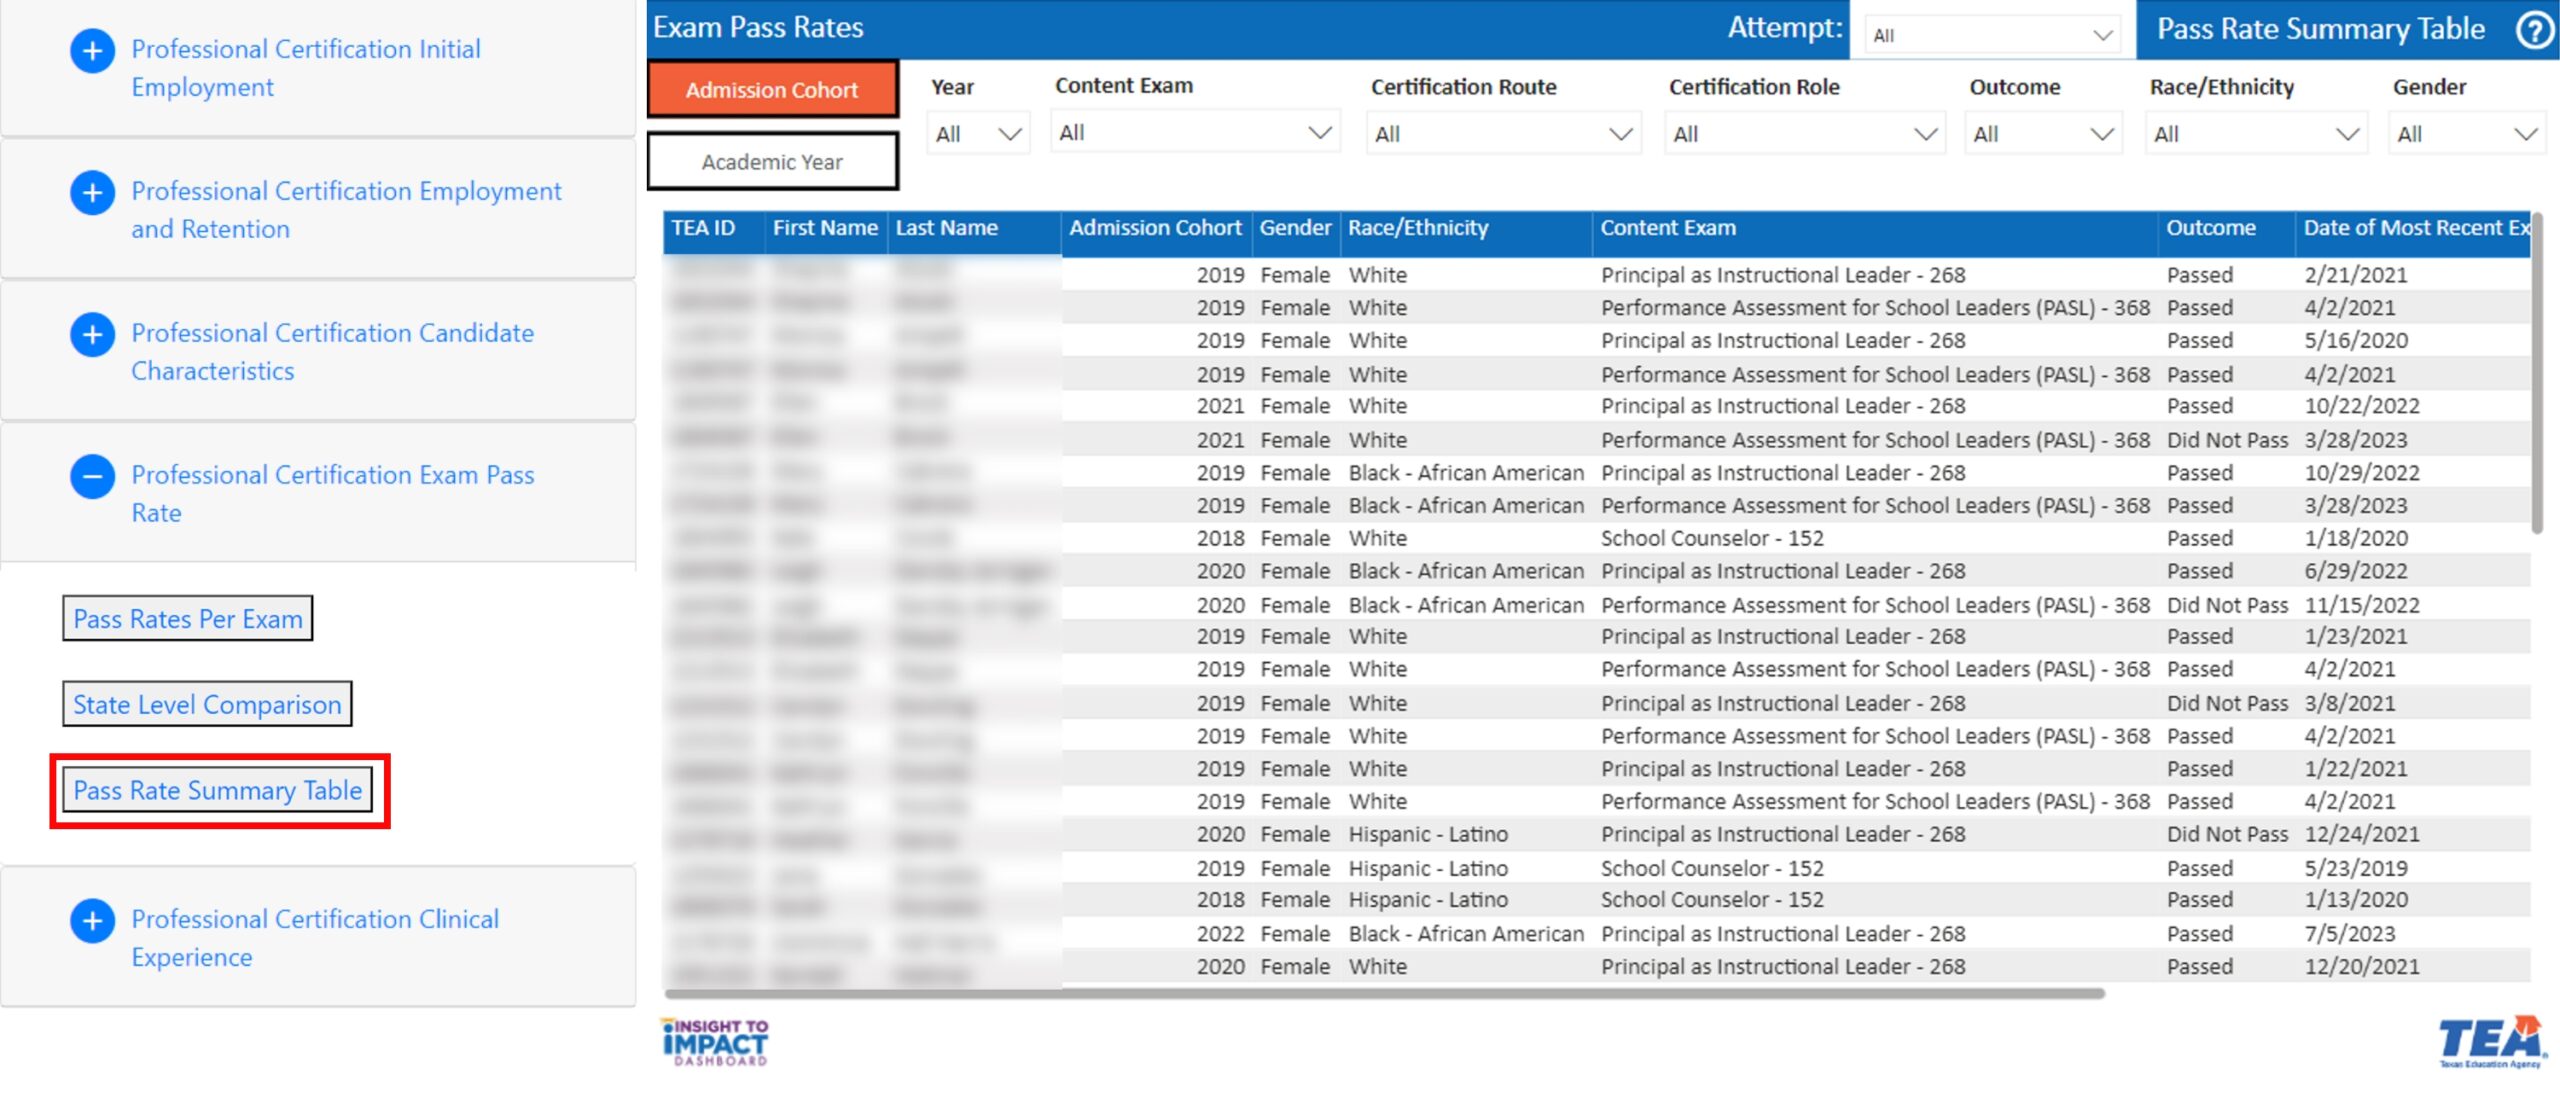
Navigate to Pass Rate Summary Table
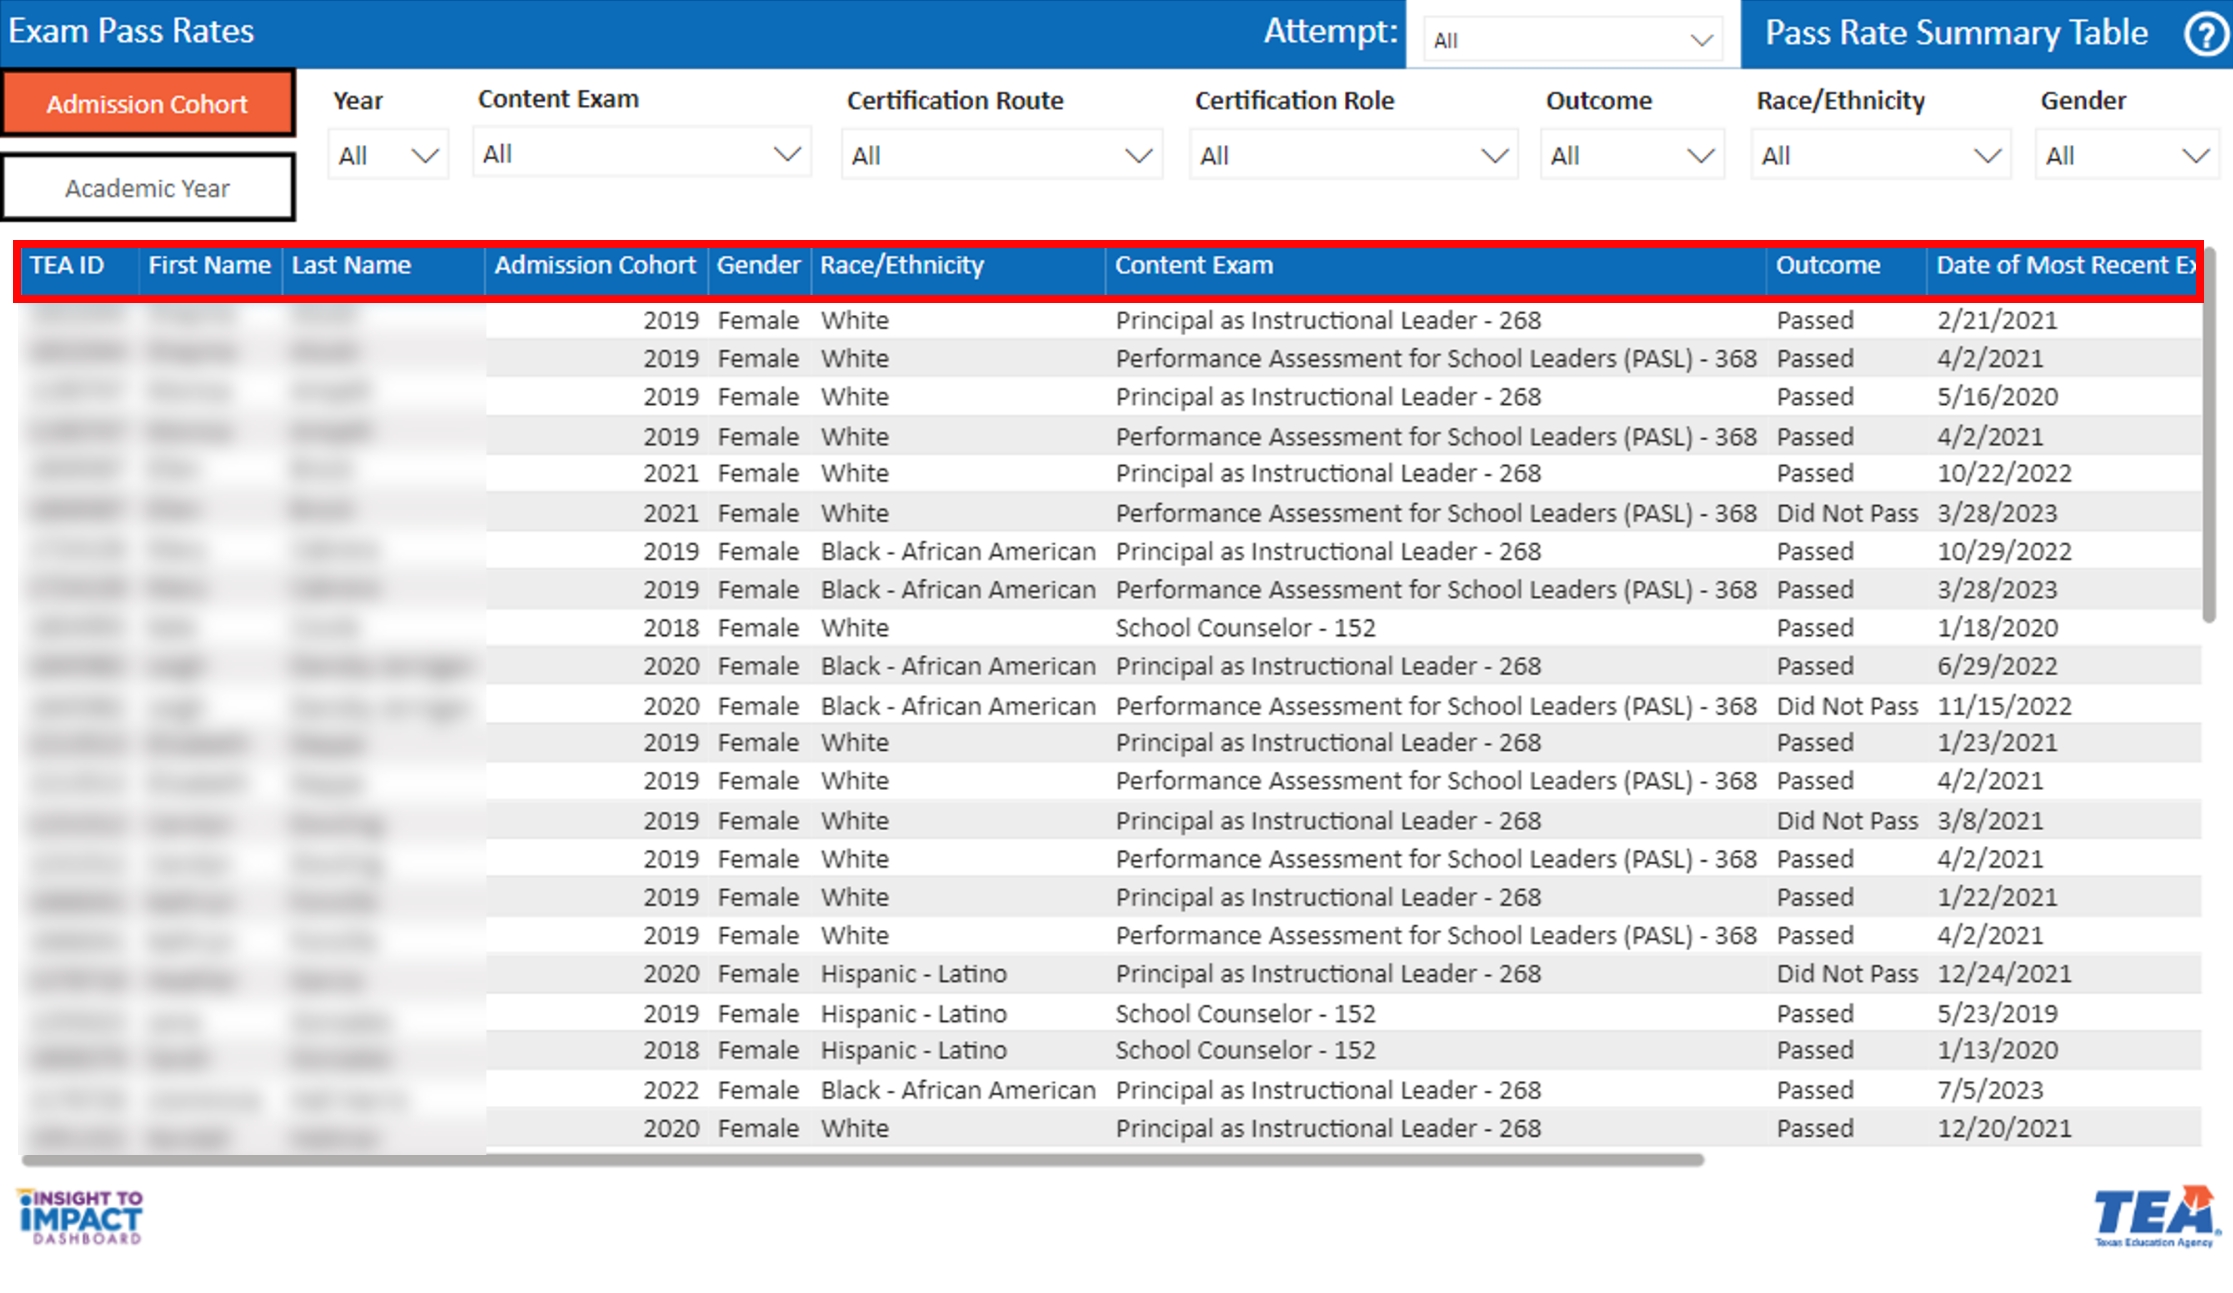
- Select the “Pass Rate Summary” page from the menu. On this page, you will be able to filter information by Year, Content Exam, Certification Route, Certification Role, Outcome, Race/Ethnicity, and Gender. The “Pass Rates Summary” table uses 12 key indicators that can be sorted.
- Use the “Pass Rates Summary” table to sort and filter data according to the indicators for your EPP. This view will change based on your selected filters and selection of Admission Cohort or Academic Year and First, Second, or Best Attempts on exams.
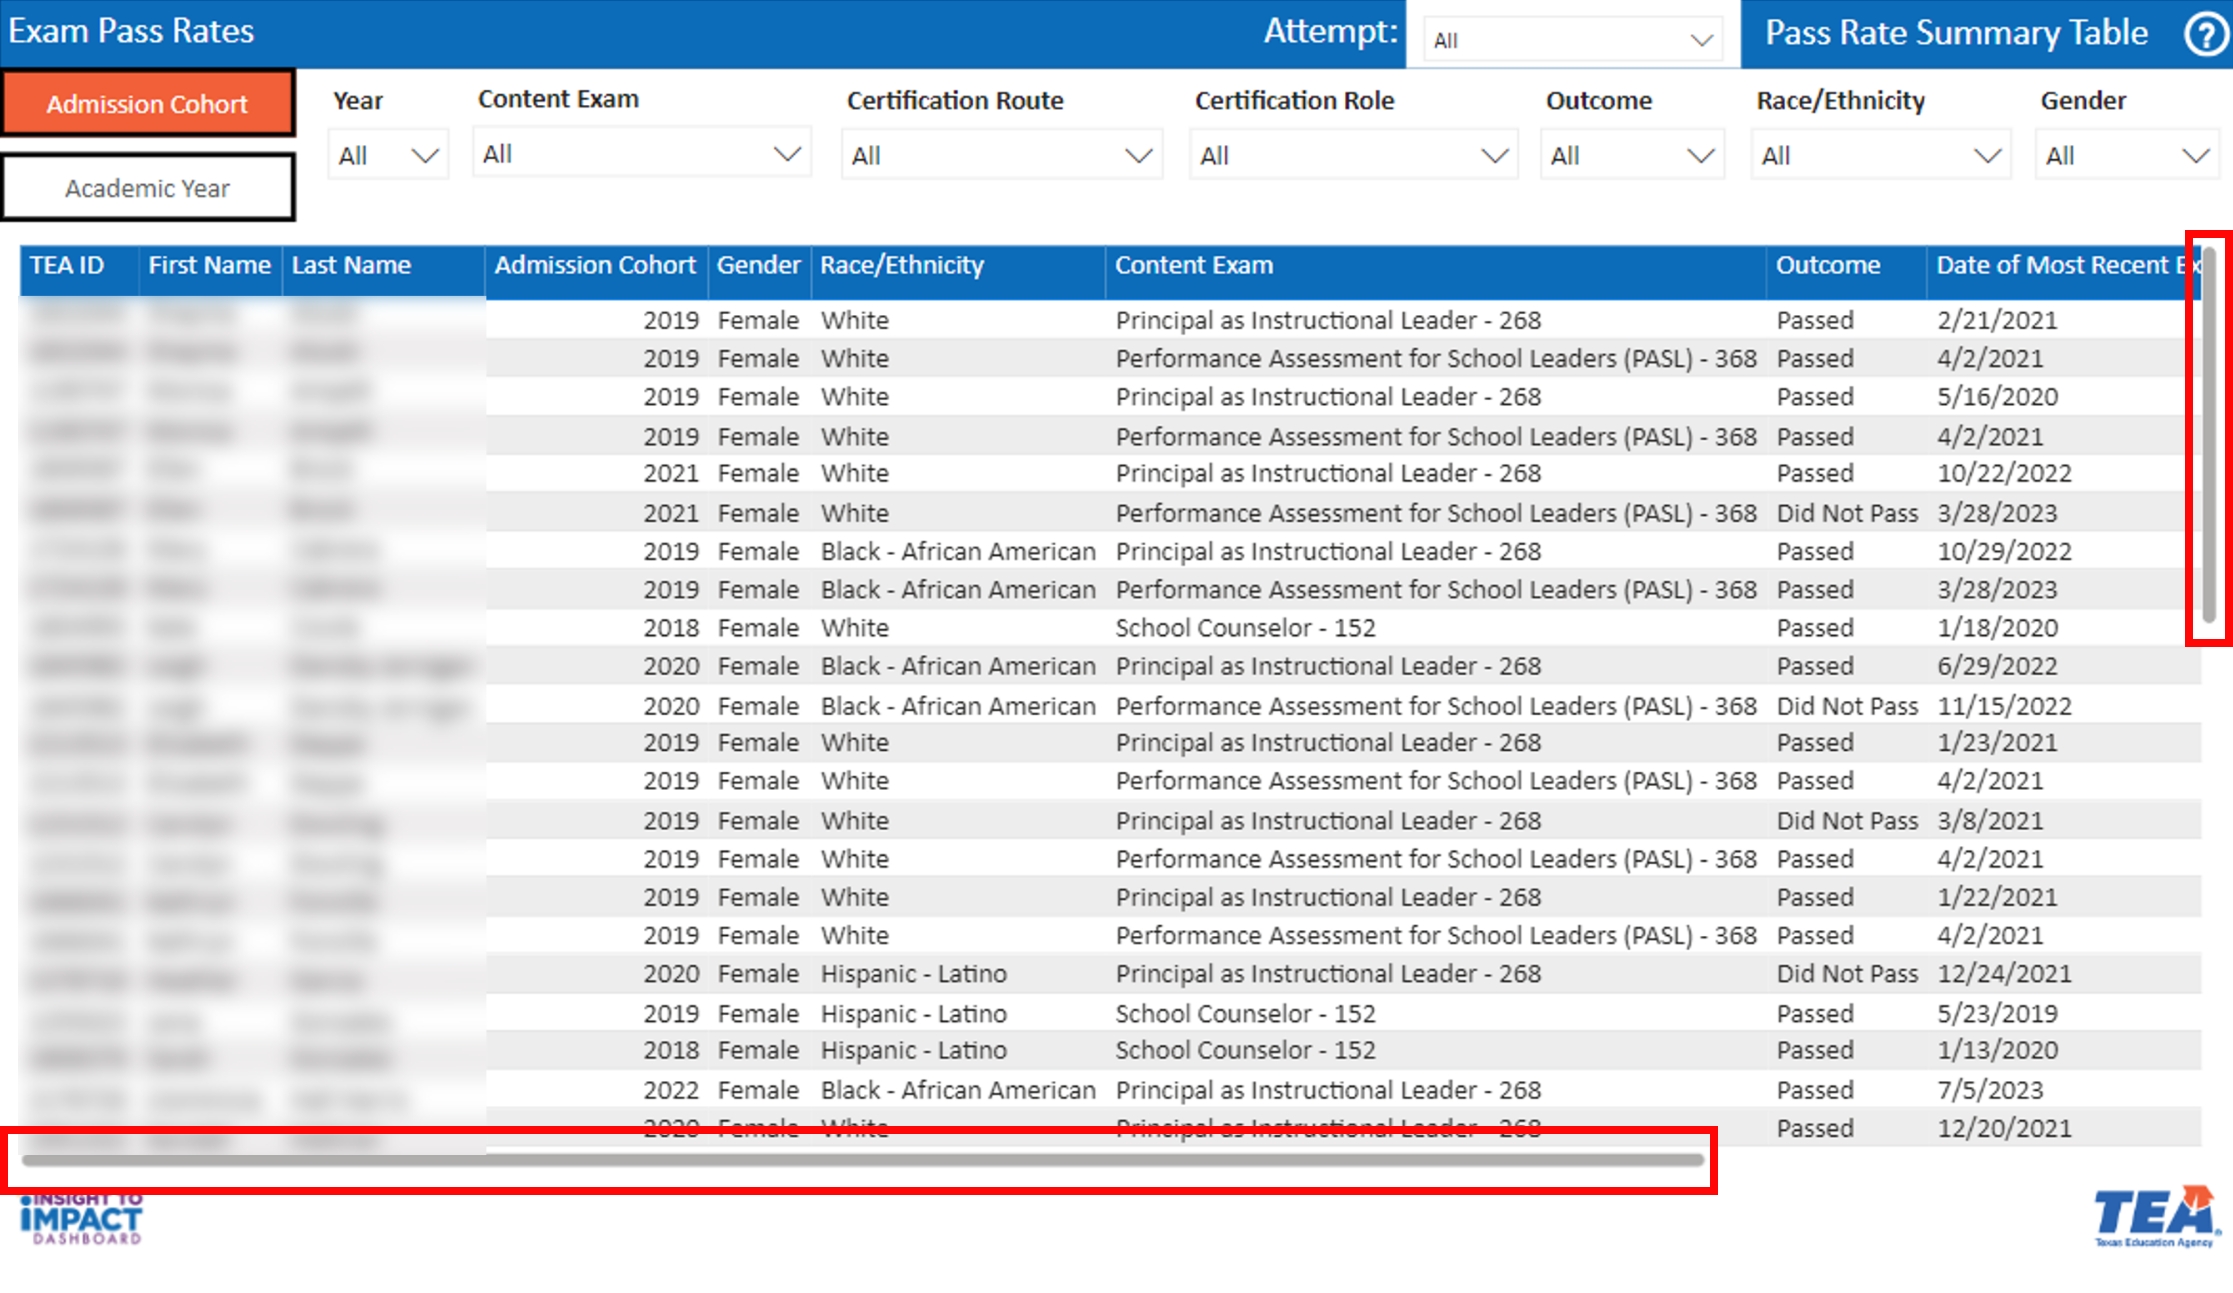
- For the “Pass Rates Summary” table you may need to use the scroll bar on the right to view all of the candidates or the scroll bar on the bottom to view more columns in the table.
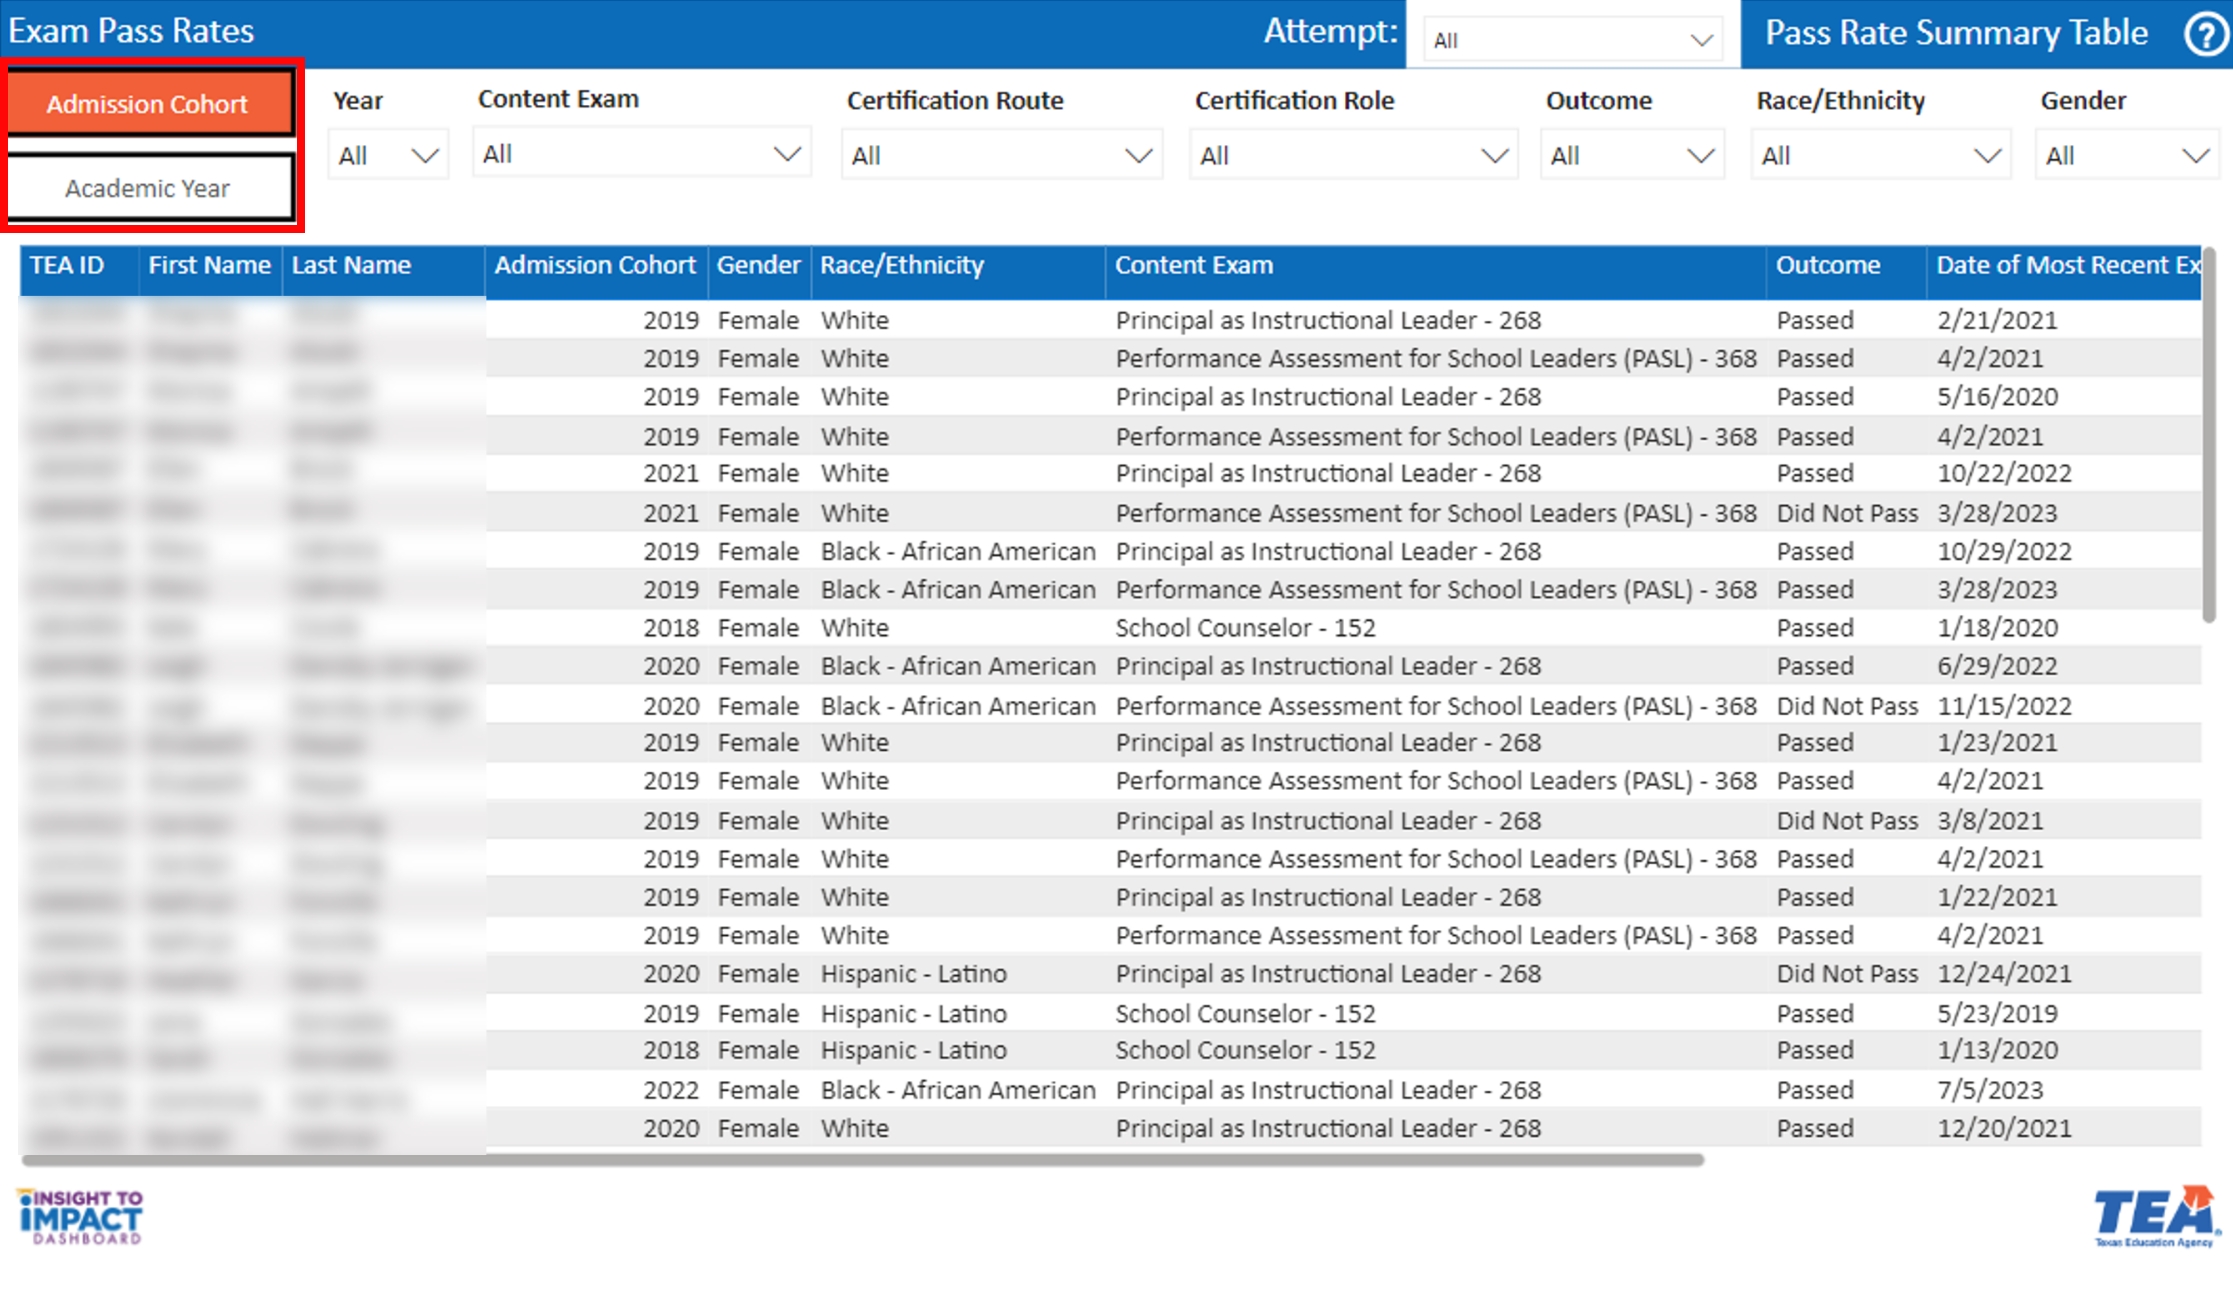
Select Admission Cohort or Academic Year
Use the Academic Cohort button to view exam pass rates for a specific cohort or use the Academic Year button to view exam pass rates for a specific year.


