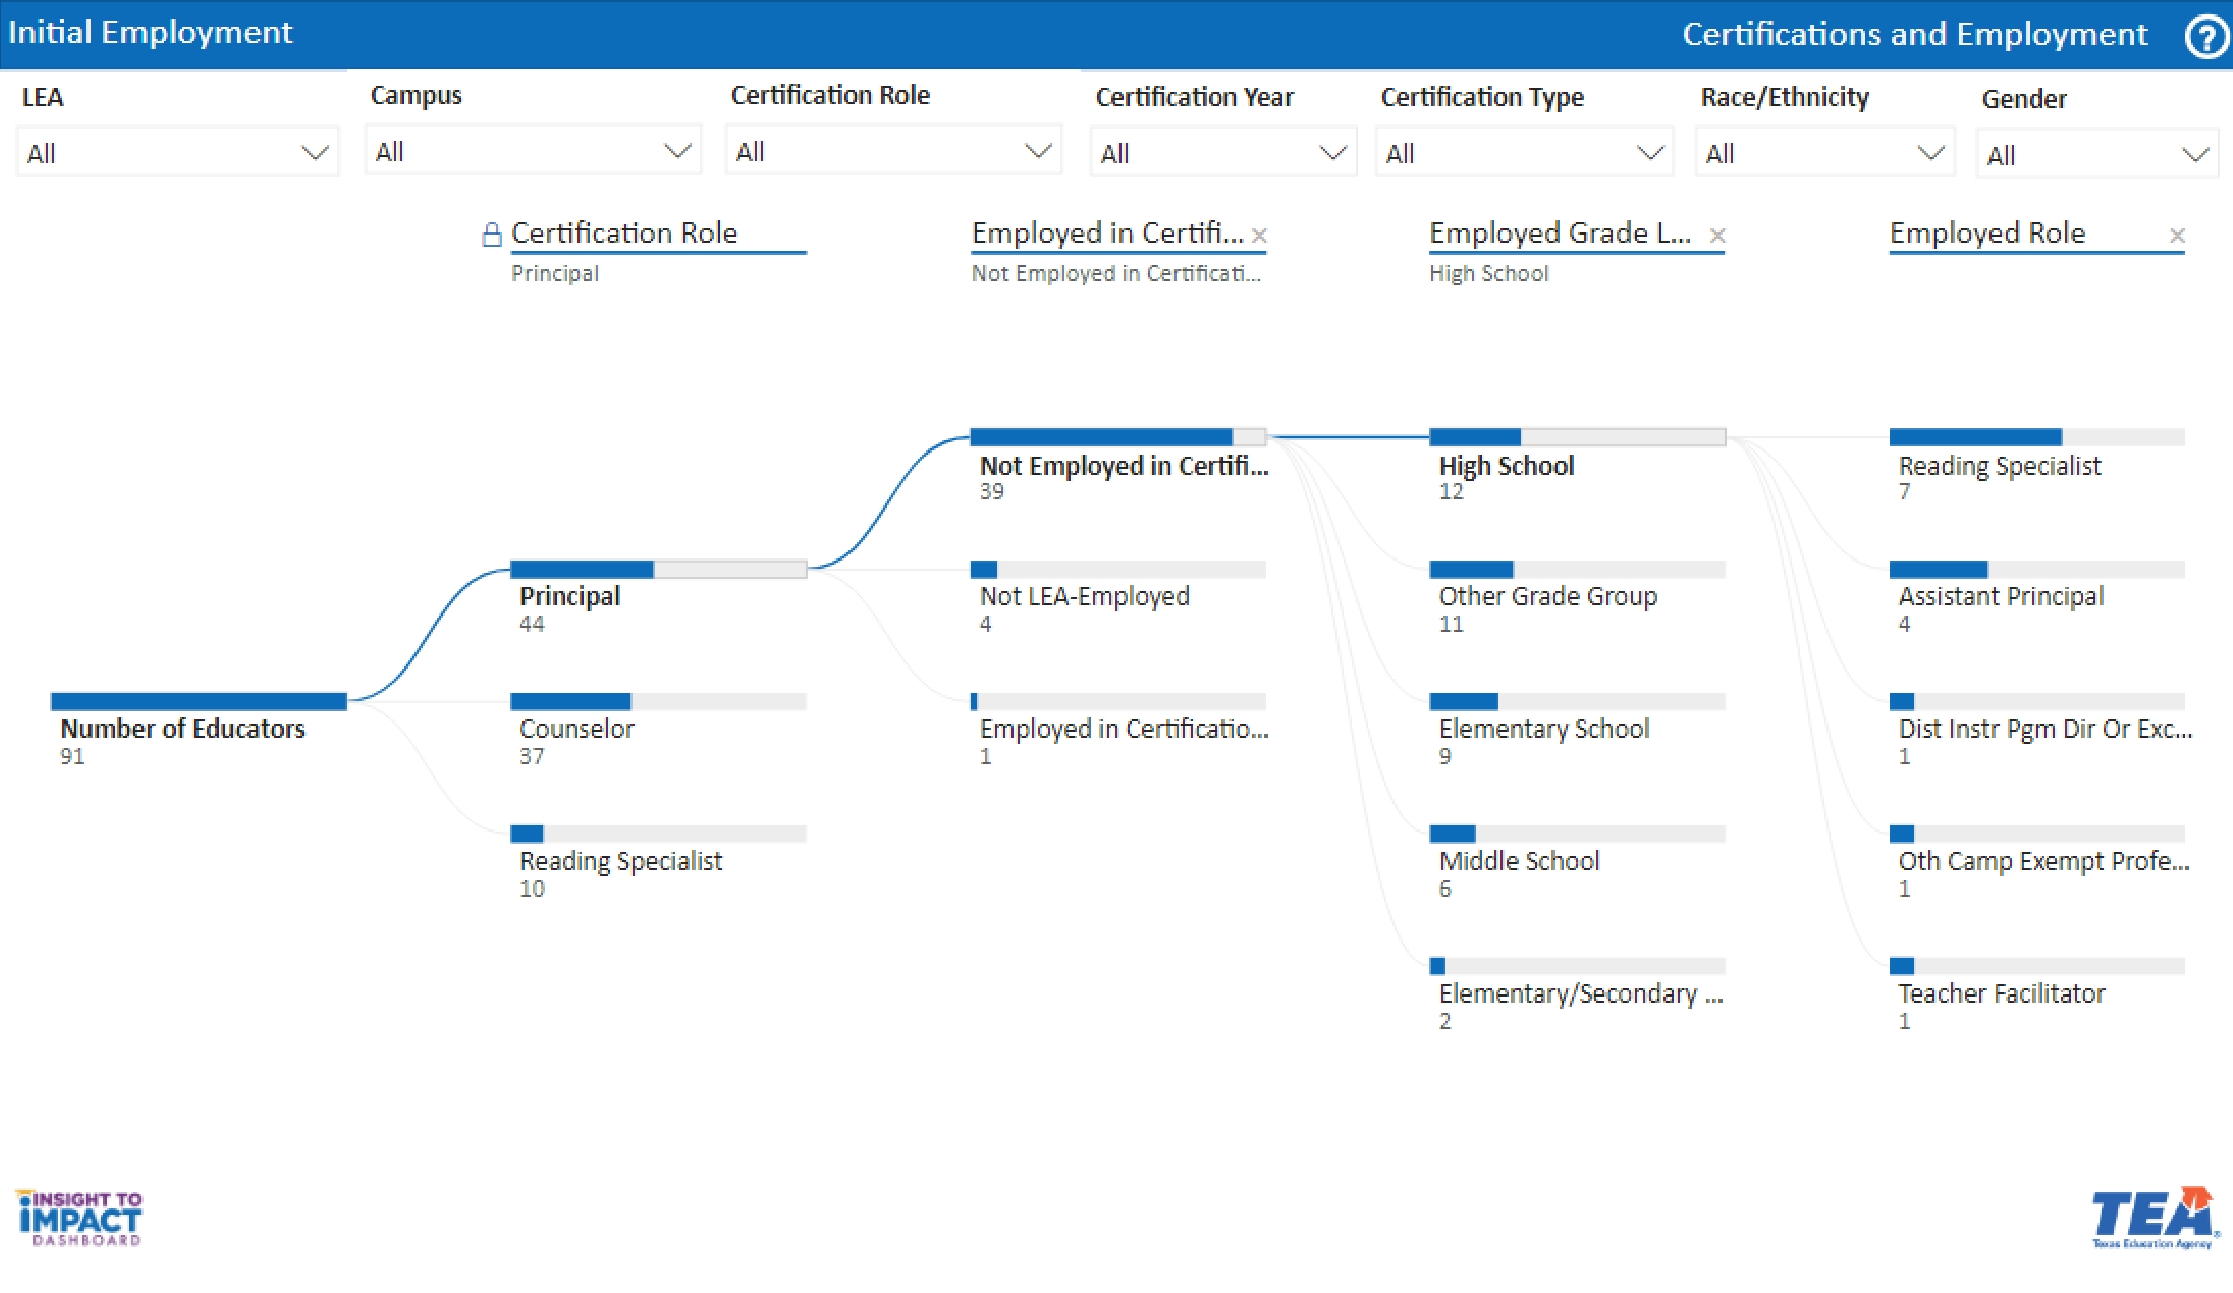
Certifications and Employment
Selecting Categories and Subcategories in the Tree Graph
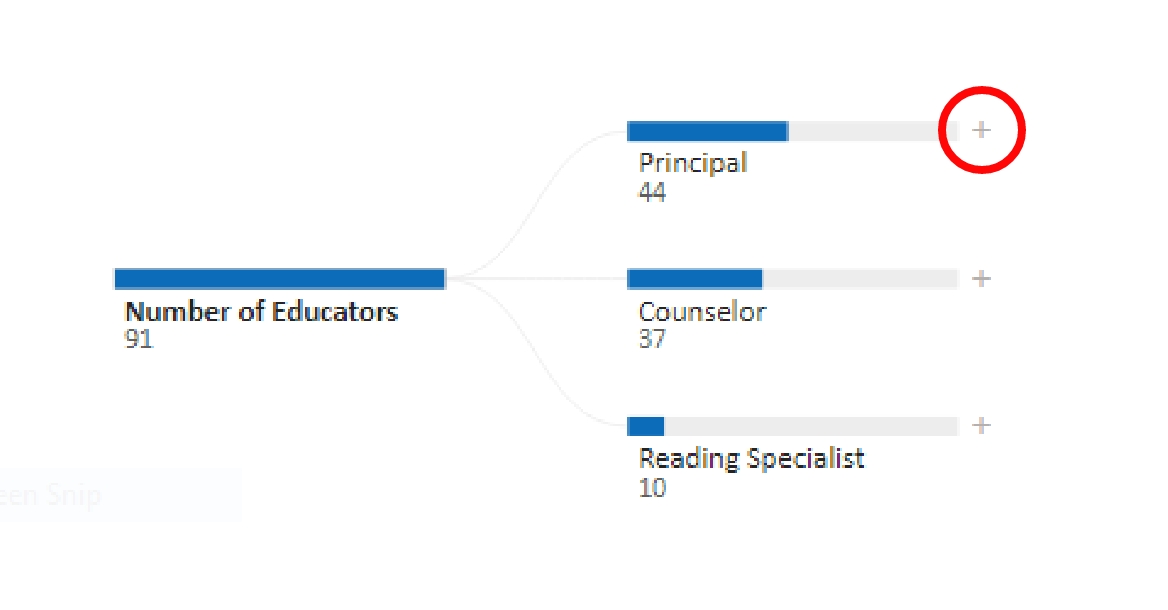
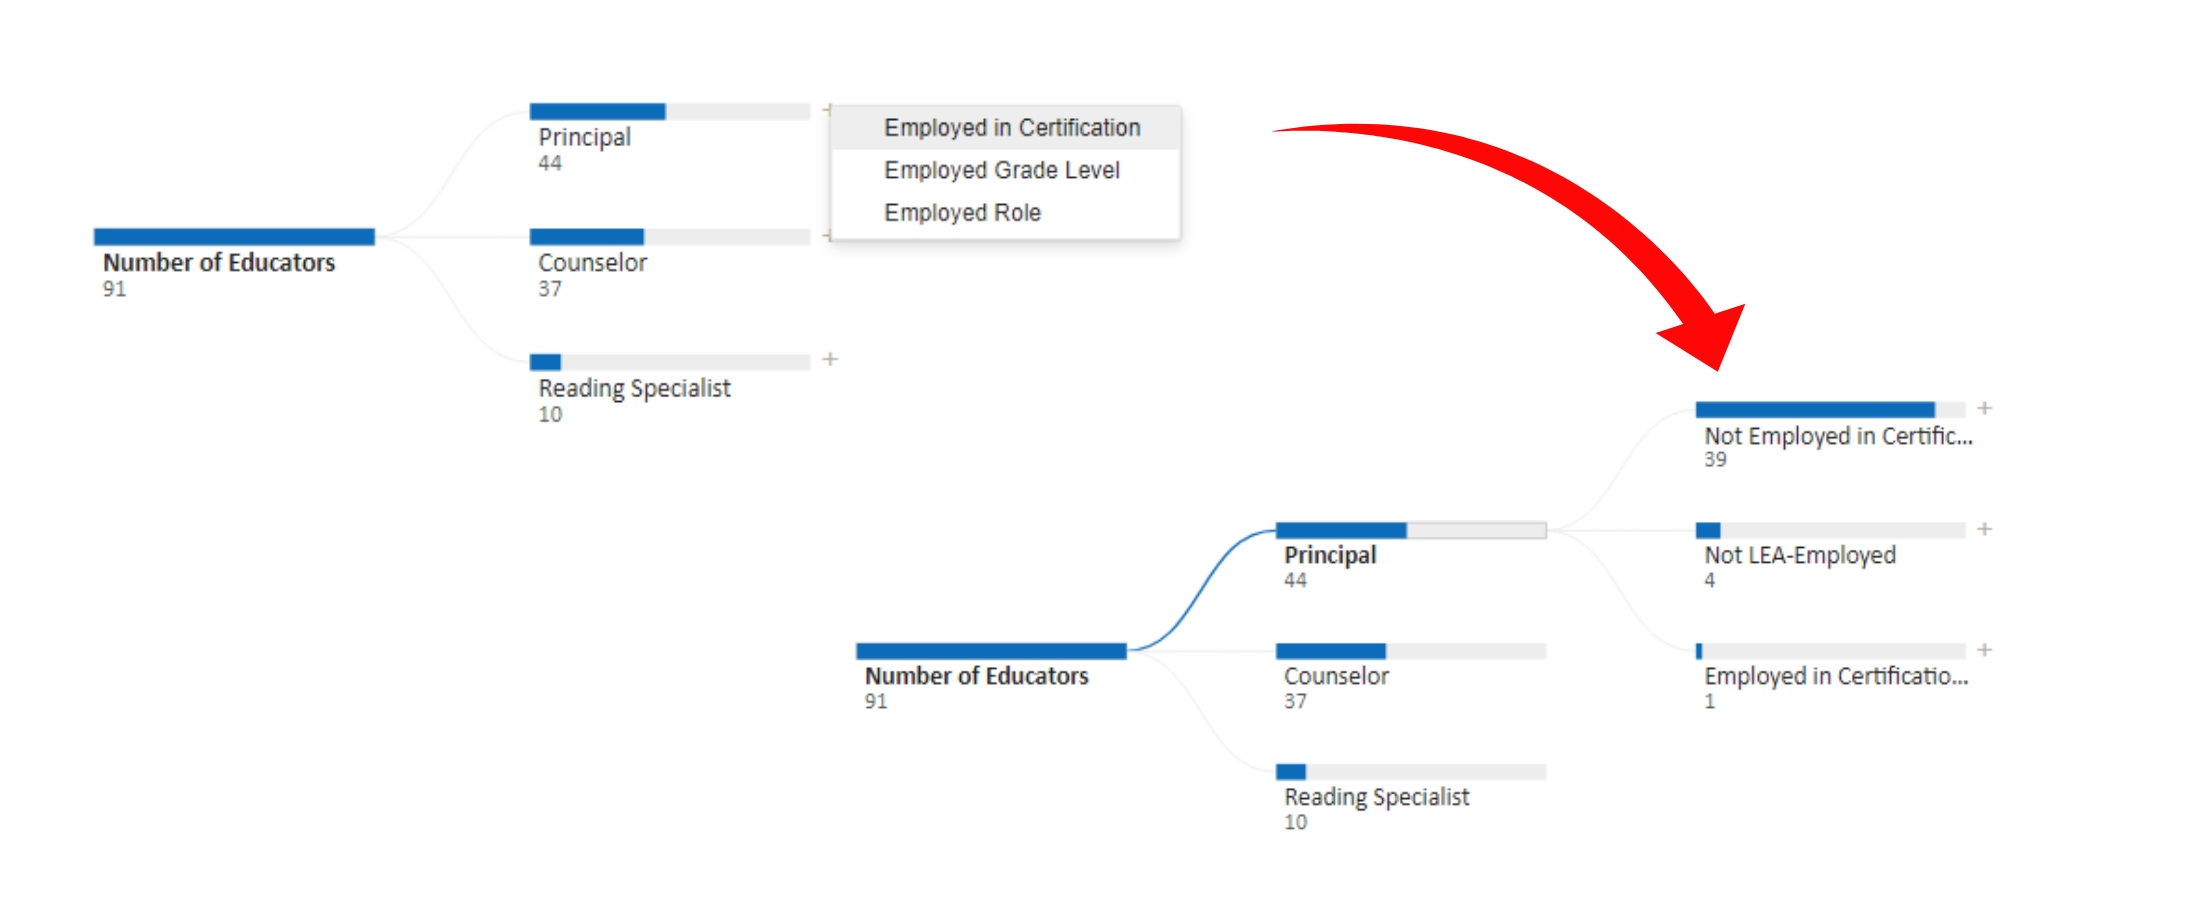
- Click on the “plus” sign to select how you want to split the count of a Certification Role. The options are: Employed in Certification, Employed Grade Level, and Employed Role.
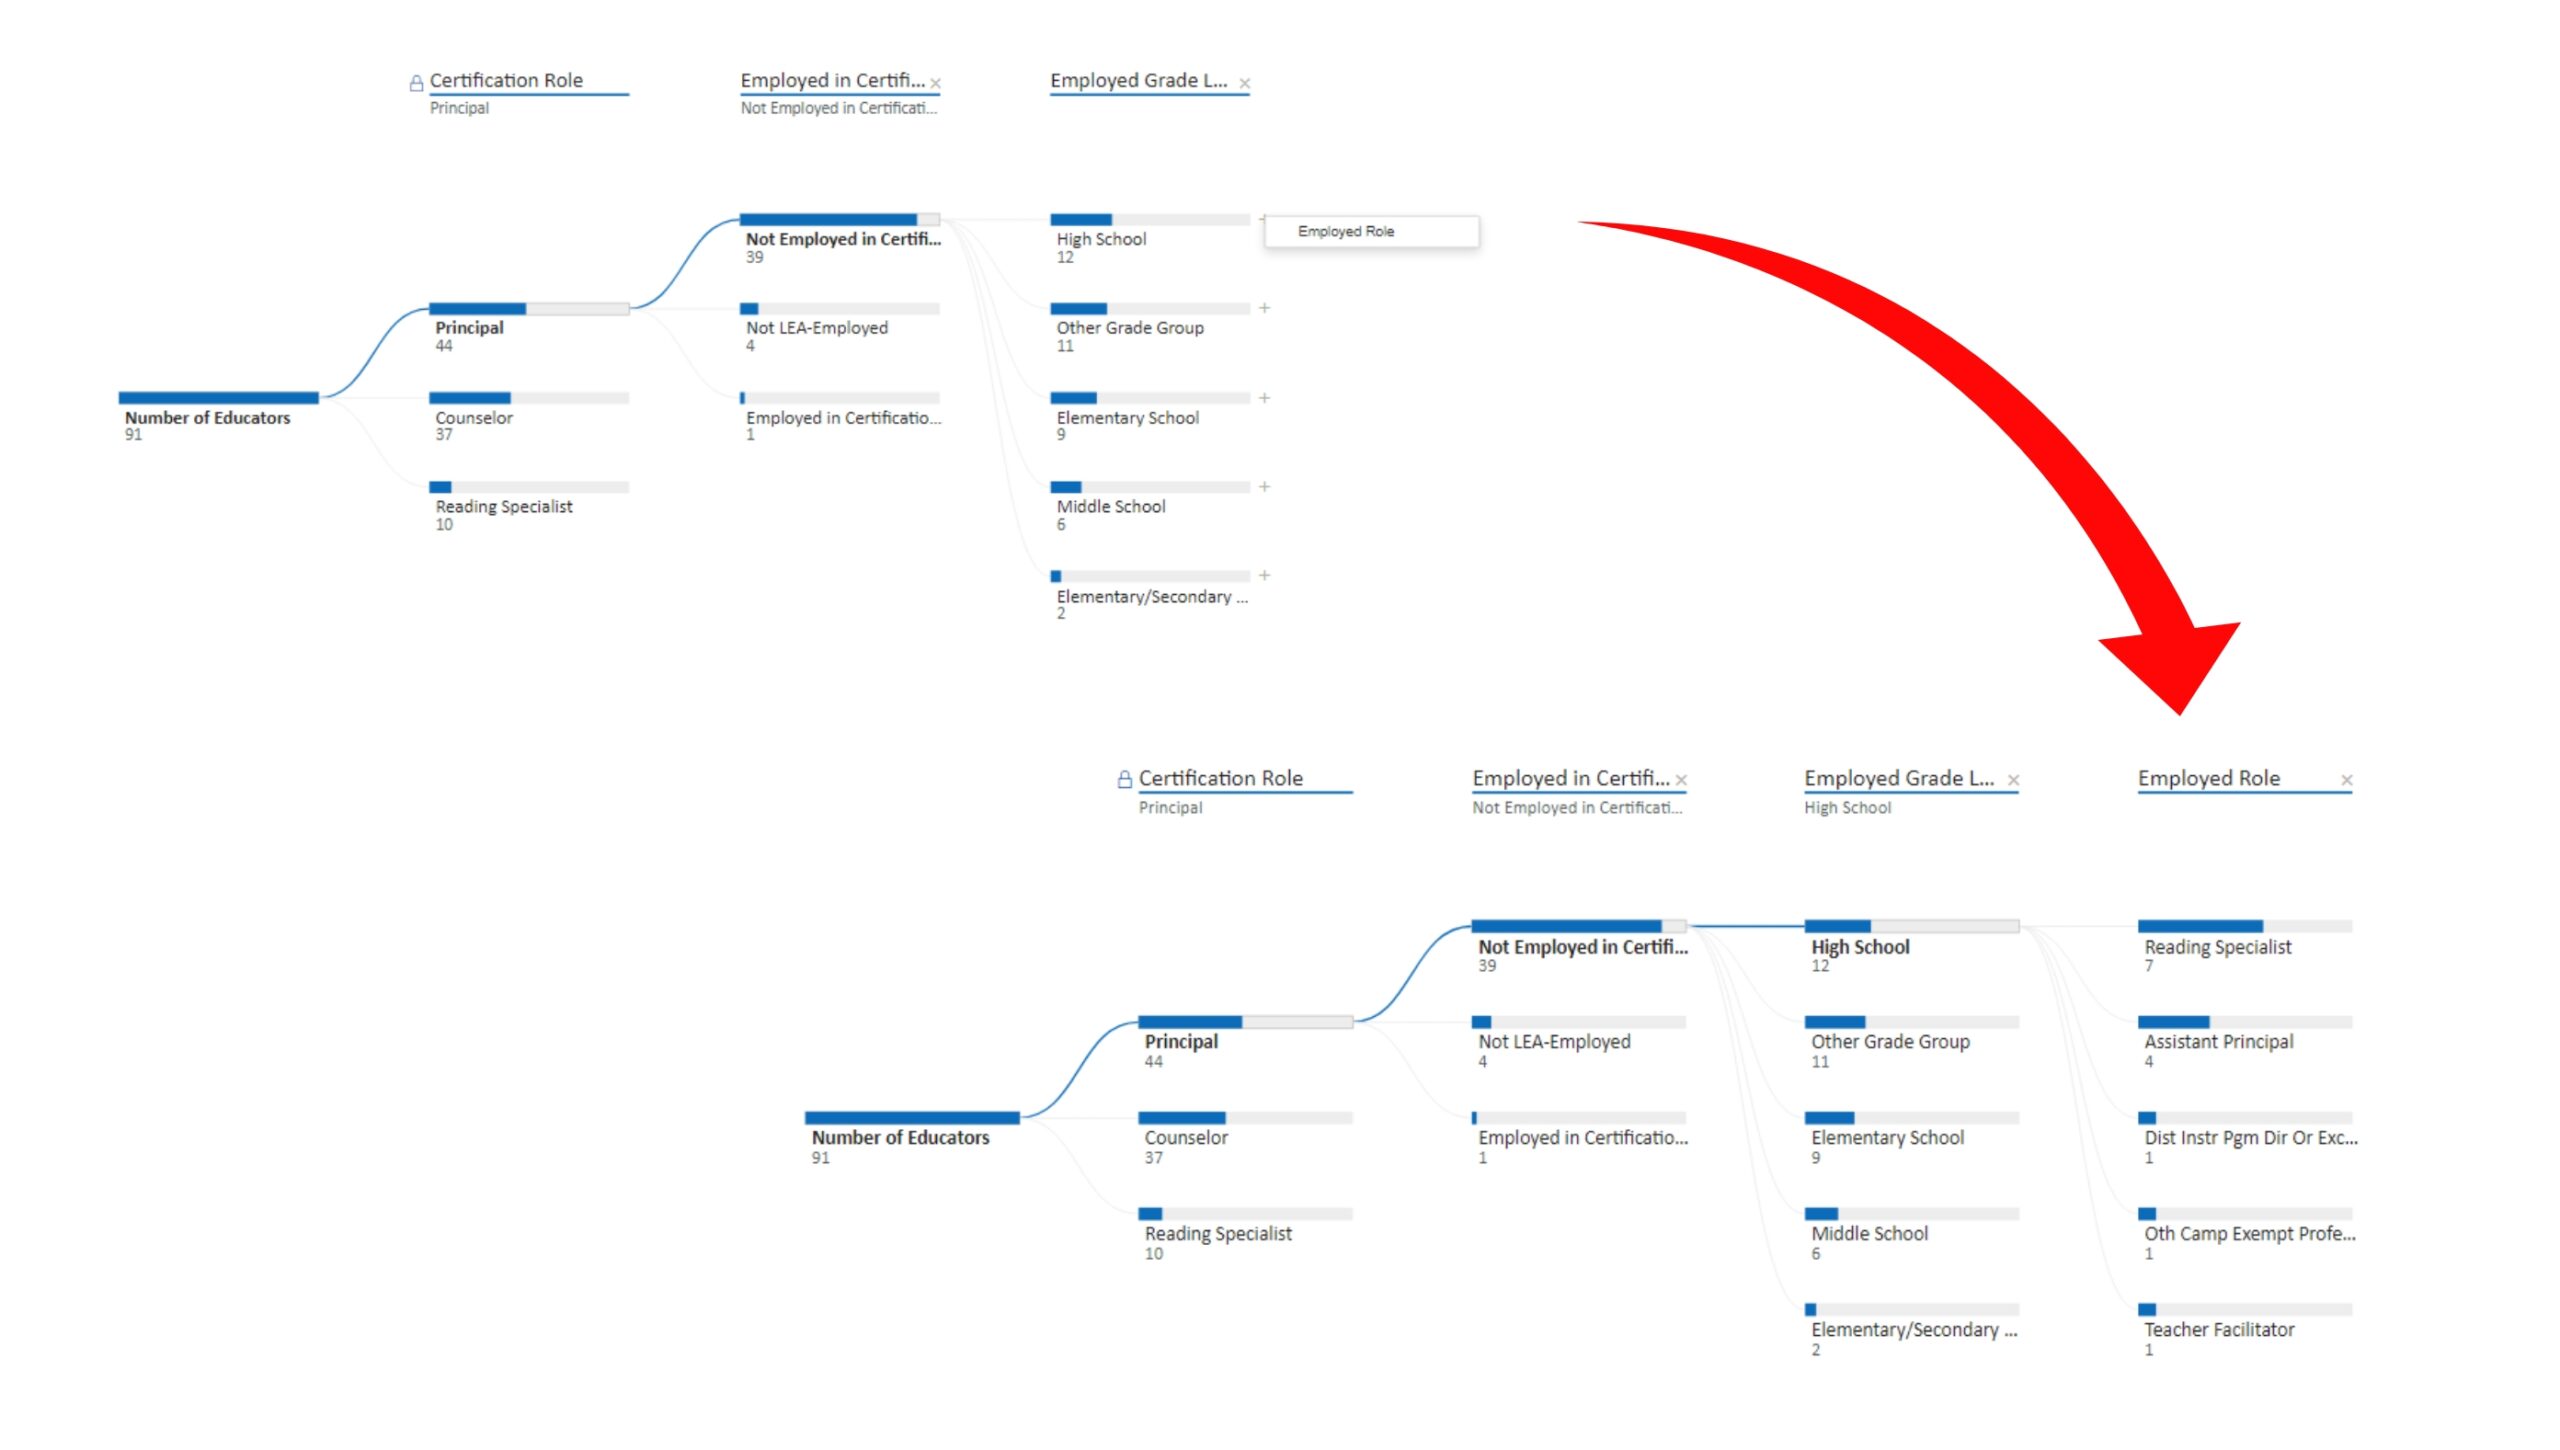
- Select an option from the pop-up list to add a branch to the graph. A new column will be added to the graph showing a series of branches displaying the counts of candidates for each category selected. (In the example below, “Employed in Certification” is selected and the “Employed in Certification” column is added. New branches can then be added according to your preference.
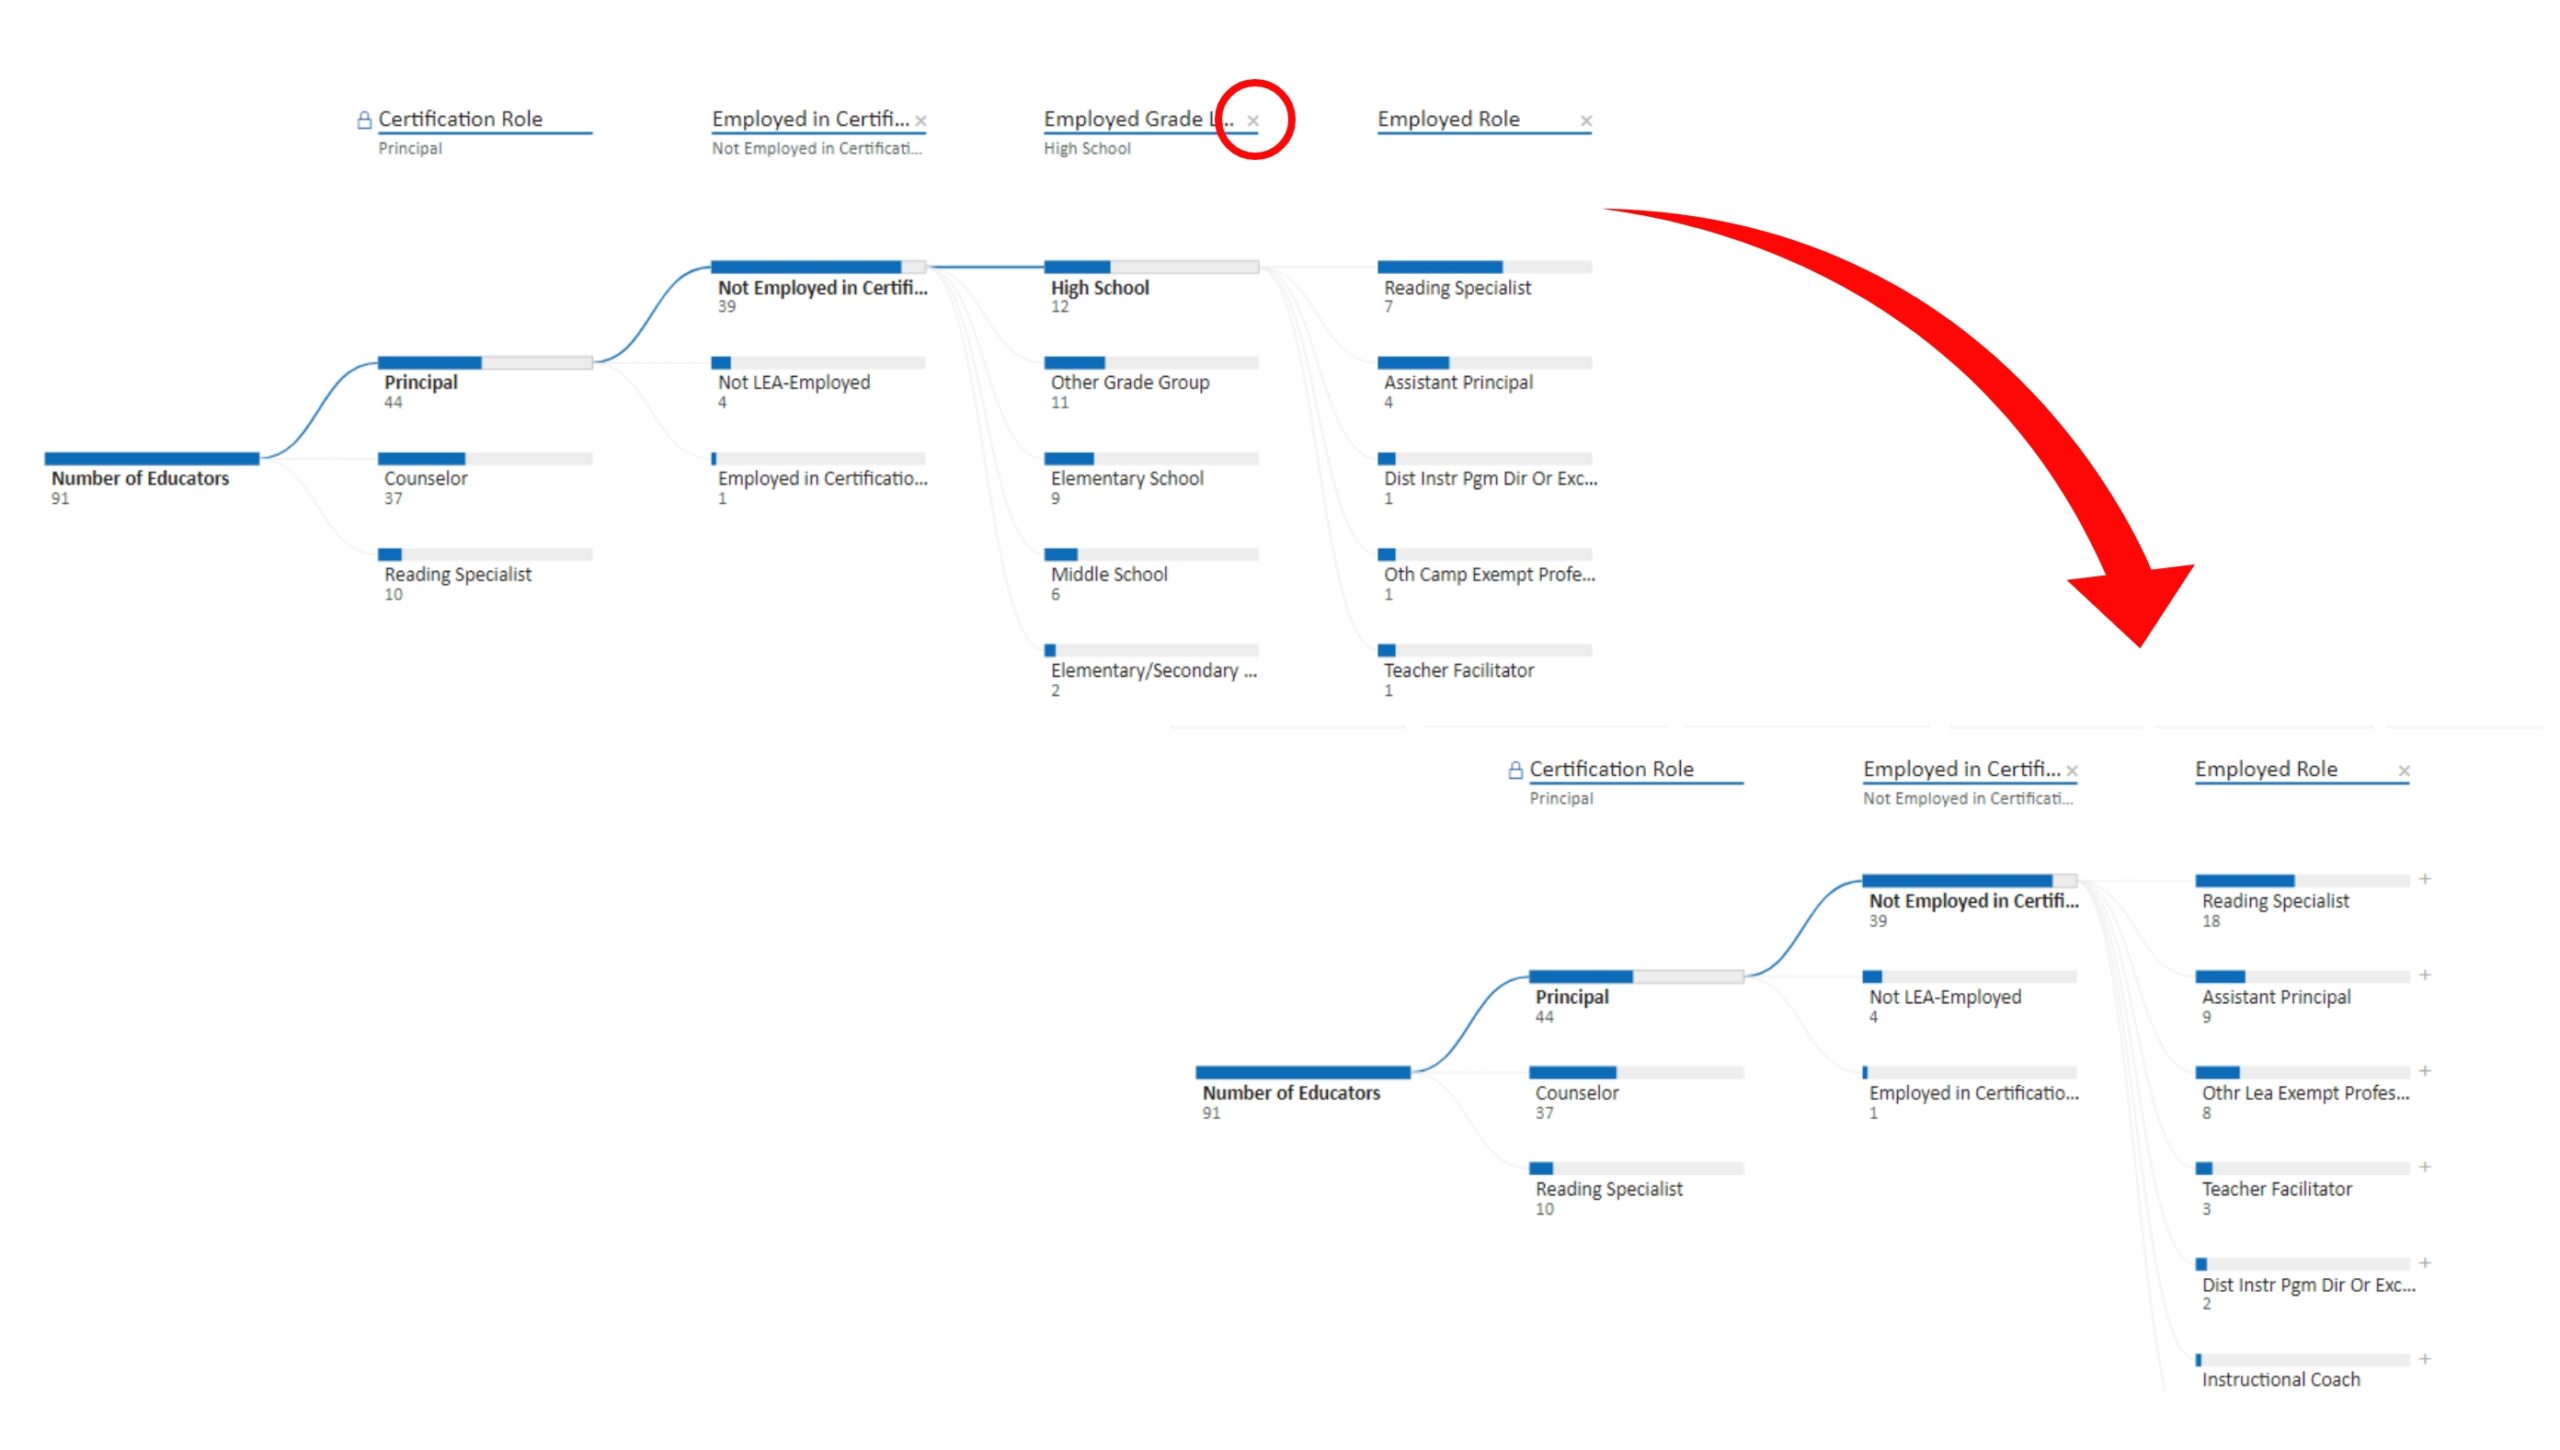
- You can continue selecting categories and adding columns and branches until all 3 categories have been used. (In the example below, the following selections were made: Principal, Employed in Certification: Not Employed in Certification Area, Employed Grade Level: High School, and Employed Role. This view will change based on your selected filters and options.
- Click the “x” at the top of a column to collapse the column and branch. You can choose to collapse the columns and branches in any order.

